0
$\begingroup$

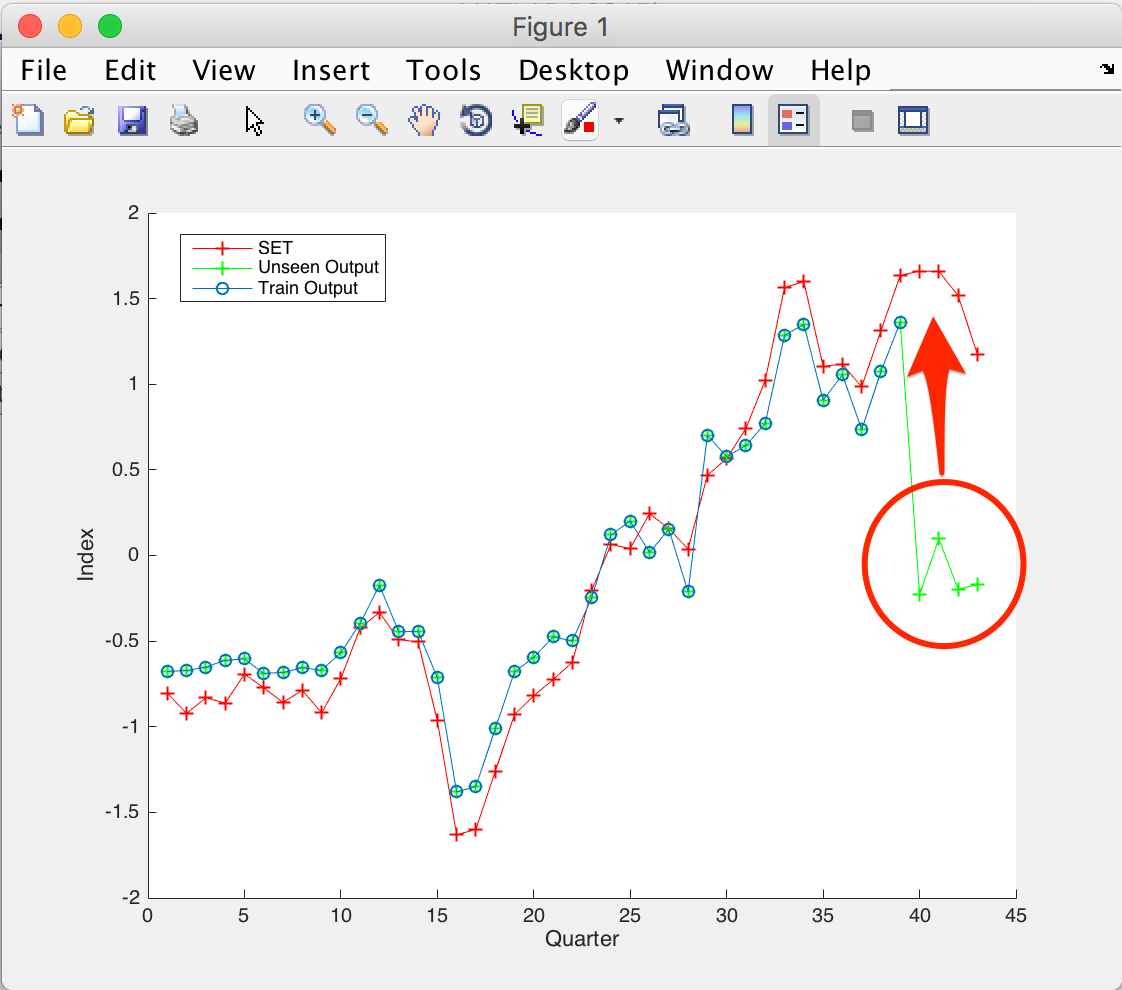
Why I select the SVMR because It has shown its great advantage in small sample learning and do not require stationary process. However, I have trouble doing support vector regression for a month. Even though, I have done smoothing (monthly to quarter) for outlier reduction but I still suffered from outlier. The training process seem to be normality but when I used the unseen data for testing the model the result is not work. As you can see in the figure, the forecasted output have shifted down from the actual line. Is there anyone can suggest what happen with my model?

Regards, W. Amontep

  • Model : Support Vector Regression (kernel : RBF)
  • Data type : Time series of Stock index (43 quarter)
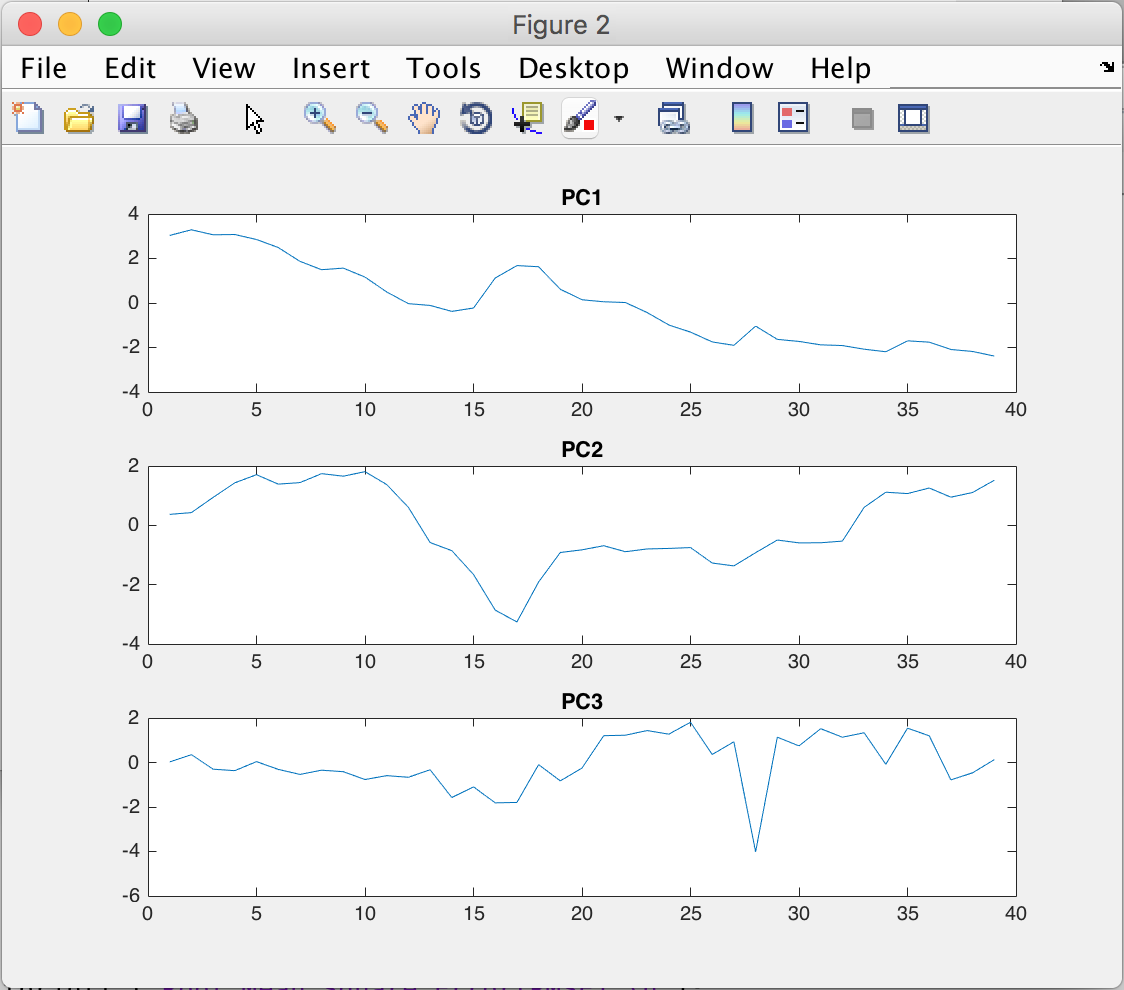
  • Pre-processing data : Dimension reduction using PCA
  • Number of Training : 39
  • Number of testing : 4

model fiting Series plot load 'New_selected'

New_selected = zscore(New_selected);
SET = zscore(SET);

mm = mean(New_selected(1:39,:));
NumOfPC = 3;
[COEFF,SCORE,latent] = pca(New_selected(1:39,:)); %PCA
Ro_COEFF = rotatefactors(COEFF(:,1:3));
ro_pca = gen_pca(New_selected(1:39,:),Ro_COEFF,mm,NumOfPC);

svmdl = fitrsvm(ro_pca(:,1:3), SET(1:39),'KernelFunction','rbf','KernelScale','auto');

unseen_data = New_selected(40:43,:);
unseen_pca = gen_pca(unseen_data, Ro_COEFF,mm,NumOfPC);
cont_pc = [ro_pca; unseen_pca];

trainOutput = predict(svmdl,ro_pca(:,1:3));    
testOutput = predict(svmdl,unseen_pca(:,1:3));
con = [trainOutput; testOutput];

figure, hold on
plot(SET,'-+r');
plot(con,'-og');

% figure, hold on
% plot(SET(1:39),'-+r');
% plot(trainOutput,'-og');

rmse = @(y,yh)(sum((y(:)-yh(:)).^2 / numel(y)));
fprintf ('Root Mean Square Error(RMSE).\n');
rmse(SET(40:43),testOutput)
$\endgroup$
5
  • $\begingroup$ Just from your plot, it seems your model is overfitting---it captures the training data too well. How did you select the hyper parameters? $\endgroup$
    – user112758
    Commented May 11, 2016 at 9:09
  • $\begingroup$ Absolutely, I agree with you I suffered from overfitting. However, I used to try to make a generally model(not overfit) but the result is the same. $\endgroup$
    – Morleng
    Commented May 11, 2016 at 9:19
  • $\begingroup$ researchgate.net/post/… $\endgroup$
    – Morleng
    Commented May 11, 2016 at 9:47
  • $\begingroup$ What's your data, the returns for 43 quarters of one index? multiple indices? $\endgroup$ Commented May 11, 2016 at 11:45
  • $\begingroup$ Your series has no pattern, when there is no pattern it is impossible to forecast no matter whatever technique you use. $\endgroup$
    – forecaster
    Commented May 11, 2016 at 14:09

1 Answer 1

2
$\begingroup$

This whole exercise faces formidable, fundamental obstacles. What you are trying to forecast is at the edge of being almost entirely unforecastable.

  • Almost nothing forecasts future stock price movements. Consistent with the theory of efficient markets, stock returns are remarkably random!
    • There is almost no autocorrelation among stocks.
    • They move remarkably closely to geometric Brownian motion (fatter tails though).
    • The number of mutual fund managers that outperform the market is broadly the same as what you would expect by chance.

The theory of efficient markets says that markets incorporate all publicly available information into stock prices. (A corollary is that any variation in expected returns is compensation for risk.)

  • While almost no one believes the efficient market hypothesis completely, it's a good starting point. When someone claims to have found something that forecasts stock returns, they very likely just overfit the data. If something does forecast stock returns, it may be compensation for risk (i.e. hard to exploit).

  • If you could forecast stock returns well, you can make obscene amounts of money. It can't be easy or everyone would do it.

Some things found in the empirical finance literature that may forecast returns over long horizons

  • The dividend to price ratio of the overall market may forecast returns over the next 5-10 year (eg. http://faculty.chicagobooth.edu/john.cochrane/research/papers/discount_rates_jf.pdf)
    • Some possible issues here in that everything is switching to share buybacks instead of dividends. Stationary ratios besides (D/P) could be used.
  • High book to market ratios forecast higher returns in the cross-section (eg. see Fama French (1992) Cross-Section of Expected Returns).
  • Momentum: Jegadeesh and Titman (1993) Returns to buying winners and selling losers
  • Profitability: Fama and French (2006) Profitability, investment and average returns

High-frequency forecasting is an almost completely different exercise, trying to discern informed vs. uninformed trades via order flow.

--

From your picture, something that forecasts the movement of an index that precisely is almost certainly unbelievable. In finance, a huge problem is overfitting.

$\endgroup$
0

Your Answer

By clicking “Post Your Answer”, you agree to our terms of service and acknowledge you have read our privacy policy.

Not the answer you're looking for? Browse other questions tagged or ask your own question.