1
$\begingroup$

I am trying to compare the classification performance of different classifiers. So far, I am using SVM, Random forest, Adaboost.M1, and Naive Bayes. 70% of the data is used for training (and then plotting the ROC curve), while 30% is used for testing (a ROC curve again). Being fairly new to ML and more specifically to ROC curves, I have the following questions:

  1. Can we compare classifiers using the ROC curve? If so, the discussion will be on AUC? In this case, should I discuss accuracy, f-measure...

  2. Should I evaluate using a ROC curve based on the training data or on the test data? Which is more meaningful? And why?

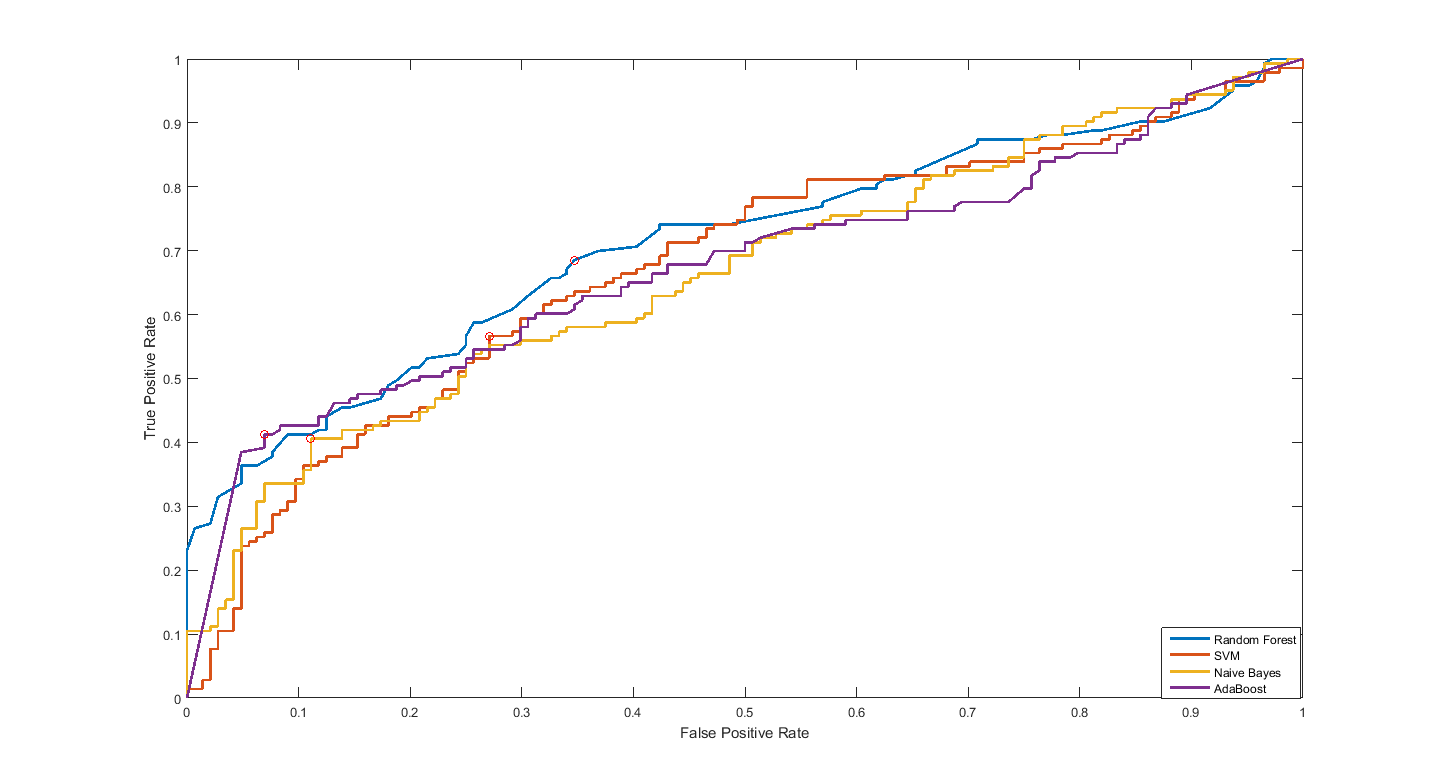
  3. In my simulation, my testing ROC curve is different from training (specifically for SVM classifier). SVM's training ROC curve is very good as compared to testing data curve (see below). Is this correct? If so, how should I analyze/present it? Pointers would be really helpful. The top one is based on the training data, where SVM's curve is very good. The bottom one is based on testing data, where SVM is not so good, and is being outperformed by random forests. So should I say that random forests is doing a good job?

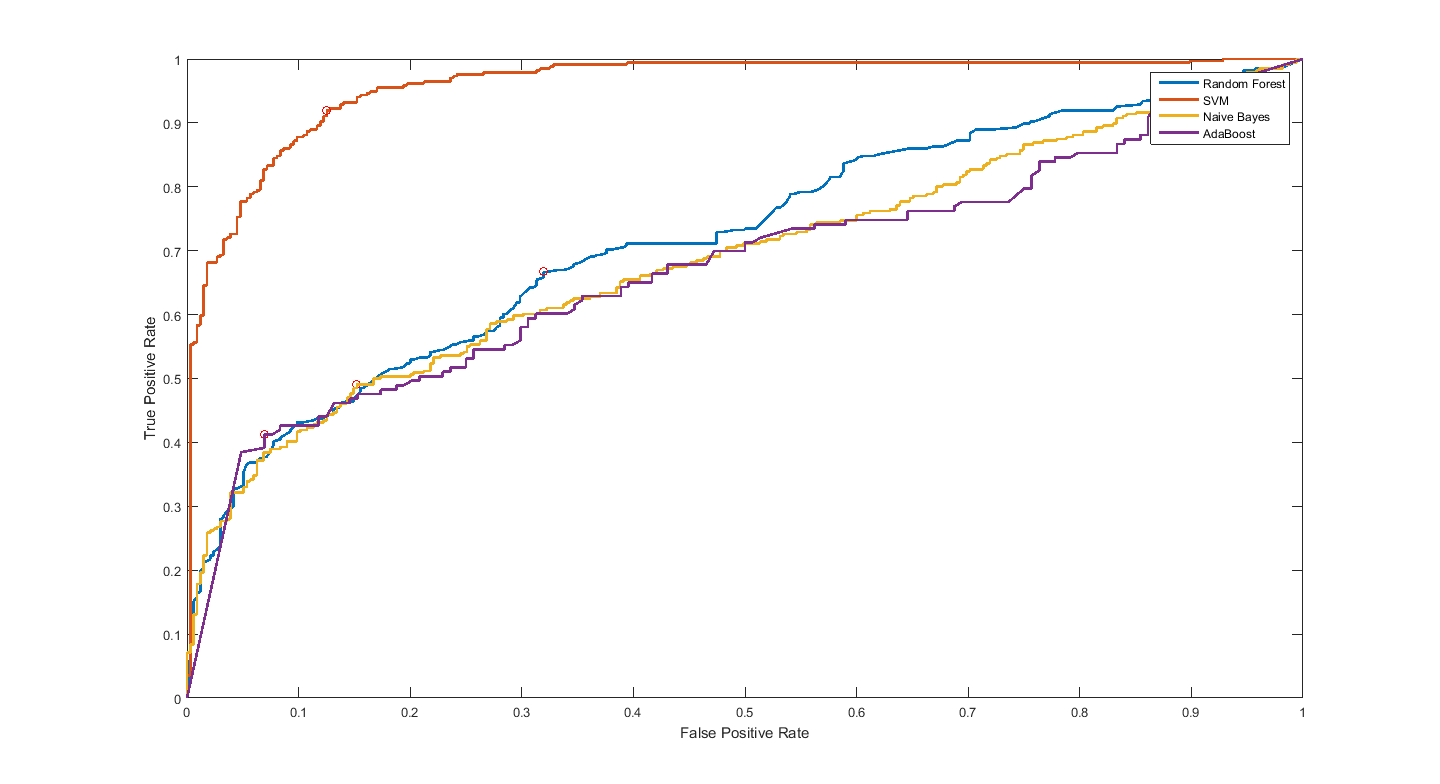
Traing ROC Curve - See how good SVM (rbf) is

Testing - Specifically SVM curve

$\endgroup$

2 Answers 2

3
$\begingroup$
  1. Yes, you can compare the AUC's of different classifiers. Including more measures such as accuracy, f-score, precision, recall etc. to the analysis might be good too.

  2. Testing measures should be better, they show you the out-of-sample performance of your system which is closer to the "real life" scenario, i.e. the performance on previously unseen data. Training measures can be helpful too, but they depend on the training algorithm itself, one algorithm might be using regularization techniques that decrease the training accuracy on purpose, while the other doesn't, but they might generalize the same, which is -I think- the case on your first figure.

  3. Yes, this is possible, I would just ignore the training curves. An improvement might be k-fold cross validation instead of dividing the dataset into %70 train - %30 test. Then you use all your dataset to measure the performance.

$\endgroup$
3
  • $\begingroup$ So when I do cross validation, I will plot the "testing sets" ROC? (after k folds) $\endgroup$
    – And_Dev
    Commented May 15, 2016 at 21:52
  • $\begingroup$ yes. when you use each one of the k folds for testing, you will have evaluated all your samples as test set, so you can plot the average performance. $\endgroup$
    – jeff
    Commented May 15, 2016 at 22:17
  • $\begingroup$ Or compute k different values for AUC if you want to do statistical tests $\endgroup$ Commented Nov 14, 2016 at 4:13
1
$\begingroup$
  1. Can we compare classifiers using ROC curve? If so, the discussion will be on AUC? In this case, should I discuss accuracy, fmeasure...

You can. Keep in mind what AUC means, i.e. it reflects the separability of classes over a continuous score. It doesn't reward the separation of hard-to -classify instances nor rewards the certainty of probabilistic scores.

  1. Training data ROC curve or testing data ROC curve? Which is more meaningful? and why?

Testing data ROC curve, of course. Consider the scenario where your classifier simply memorizes the training data (Random Forests are likely to do this), your training data AUC will be close to 1, but it's a meaningless result, it's simply a just-identified model artifact. Testing-data metrics, on the other hand, are more likely to be generalizable.

  1. In my simulation, my testing ROC curve is different from training (Specifically for SVM classifier). SVM's training ROC is very good as compared to testing data curve (See below). Is this correct? If so, how should I analyze/present it? Pointers will be really helpful.The top one is training, where SVM's curve is very good. And bottom one is on testing data, where SVM is not so good, and random forest outperforms. So should I say that random forest is doing a good job?

As @jeff said, ignore the training metrics, they aren't useful in your scenario. You could use them only to try to justify a possible overfitting with the SVM, though, but that's it.

$\endgroup$

Your Answer

By clicking “Post Your Answer”, you agree to our terms of service and acknowledge you have read our privacy policy.

Not the answer you're looking for? Browse other questions tagged or ask your own question.