I think what you probably want is (Shannon's) entropy. It is calculated like this:
$$
H(x) = -\sum_{x_i} p(x_i)\log_2 p(x_i)
$$
This represents a way of thinking about the amount of information in a categorical variable.
In R, we can calculate this as follows:
City = c("Moscow", "Moscow", "Paris", "London", "London",
         "London", "NYC", "NYC", "NYC", "NYC")
table(City)
# City
# London Moscow    NYC  Paris
#      3      2      4      1
entropy = function(cat.vect){
  px  = table(cat.vect)/length(cat.vect)
  lpx = log(px, base=2)
  ent = -sum(px*lpx)
  return(ent)
}
entropy(City)                                             # [1] 1.846439
entropy(rep(City, 10))                                    # [1] 1.846439
entropy(c(    "Moscow",       "NYC"))                     # [1] 1
entropy(c(    "Moscow",       "NYC", "Paris", "London"))  # [1] 2
entropy(rep(  "Moscow", 100))                             # [1] 0
entropy(c(rep("Moscow",   9), "NYC"))                     # [1] 0.4689956
entropy(c(rep("Moscow",  99), "NYC"))                     # [1] 0.08079314
entropy(c(rep("Moscow",  97), "NYC", "Paris", "London"))  # [1] 0.2419407
From this, we can see that the length of the vector doesn't matter. The number of possible options ('levels' of a categorical variable) makes it increase. If there were only one possibility, the value is $0$ (as low as you can get). The value is largest, for any given number of possibilities when the probabilities are equal.
Somewhat more technically, with more possible options, it takes more information to represent the variable while minimizing error. With only one option, there is no information in your variable. Even with more options, but where almost all actual instances are a particular level, there is very little information; after all, you can just guess "Moscow" and nearly always be right.
your.metric = function(cat.vect){
  px   = table(cat.vect)/length(cat.vect)
  spx2 = sum(px^2)
  return(spx2)
}
your.metric(City)                                             # [1] 0.3
your.metric(rep(City, 10))                                    # [1] 0.3
your.metric(c(    "Moscow",       "NYC"))                     # [1] 0.5
your.metric(c(    "Moscow",       "NYC", "Paris", "London"))  # [1] 0.25
your.metric(rep(  "Moscow", 100))                             # [1] 1
your.metric(c(rep("Moscow",   9), "NYC"))                     # [1] 0.82
your.metric(c(rep("Moscow",  99), "NYC"))                     # [1] 0.9802
your.metric(c(rep("Moscow",  97), "NYC", "Paris", "London"))  # [1] 0.9412
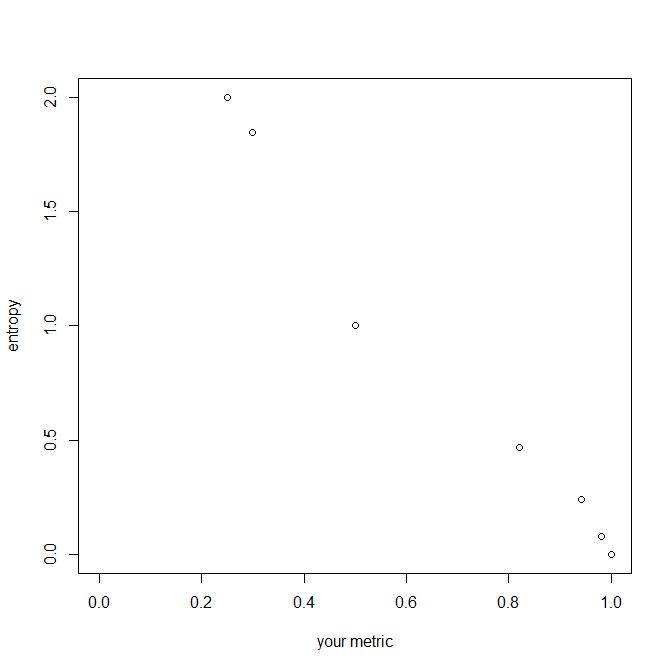
Your suggested metric is the sum of squared probabilities. In some ways it behaves similarly (e.g., notice that it is invariant to the length of the variable), but note that it decreases as the number of levels increases or as the variable becomes more imbalanced. It moves inversely to entropy, but the units—size of the increments—differ. Your metric will be bound by $0$ and $1$, whereas entropy ranges from $0$ to infinity. Here is a plot of their relationship:


