12
$\begingroup$

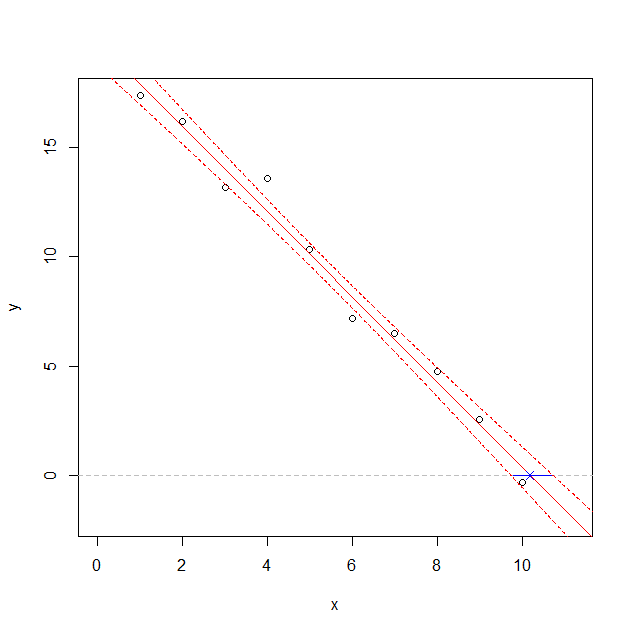
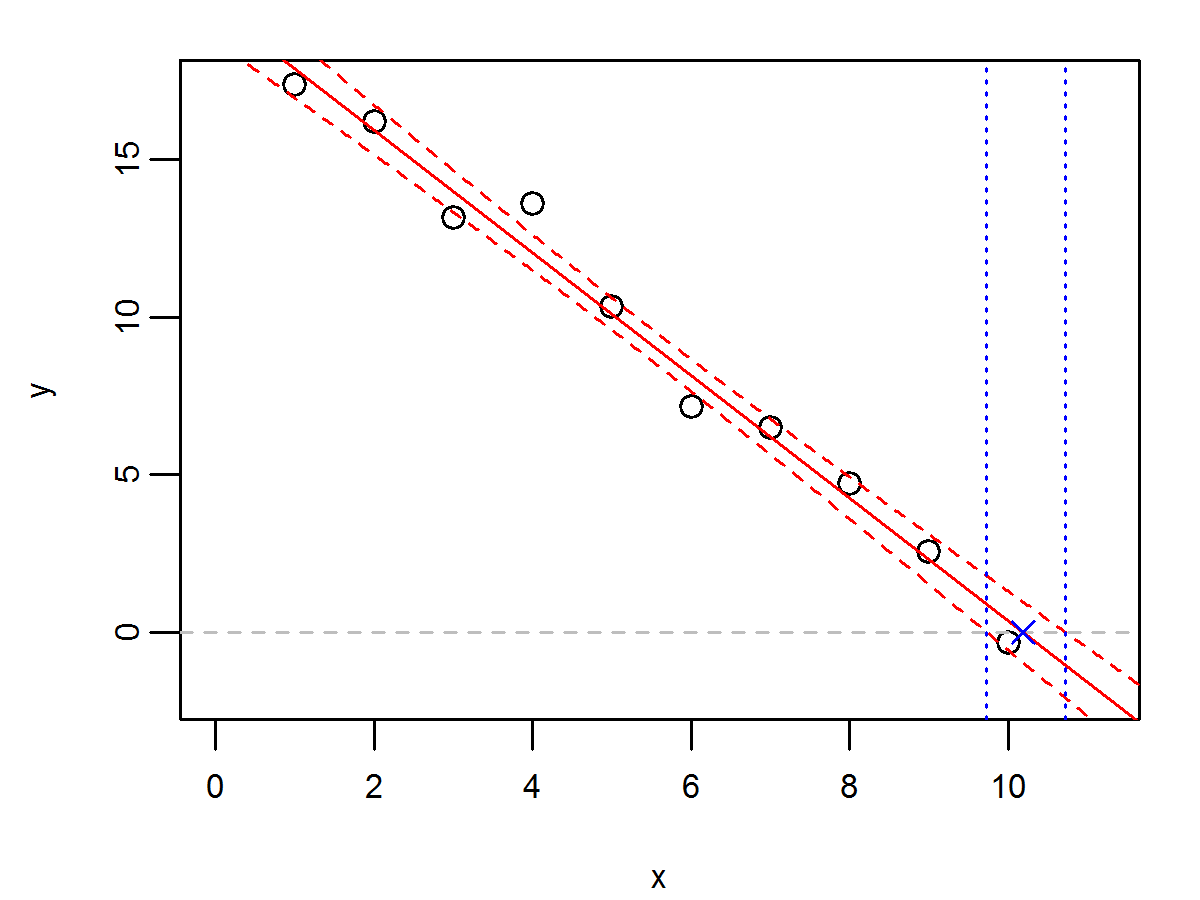
Since standard error of a linear regression is usually given for the response variable, I'm wondering how to obtain confidence intervals in the other direction - e.g. for an x-intercept. I'm able to visualize what it might be, but I'm sure there must be a straightforward way to do this. Below is an example in R of how to visualize this:

set.seed(1)
x <- 1:10
a <- 20
b <- -2
y <- a + b*x + rnorm(length(x), mean=0, sd=1)

fit <- lm(y ~ x)
XINT <- -coef(fit)[1]/coef(fit)[2]

plot(y ~ x, xlim=c(0, XINT*1.1), ylim=c(-2,max(y)))
abline(h=0, lty=2, col=8); abline(fit, col=2)
points(XINT, 0, col=4, pch=4)
newdat <- data.frame(x=seq(-2,12,len=1000))

# CI
pred <- predict(fit, newdata=newdat, se.fit = TRUE) 
newdat$yplus <-pred$fit + 1.96*pred$se.fit 
newdat$yminus <-pred$fit - 1.96*pred$se.fit 
lines(yplus ~ x, newdat, col=2, lty=2)
lines(yminus ~ x, newdat, col=2, lty=2)

# approximate CI of XINT
lwr <- newdat$x[which.min((newdat$yminus-0)^2)]
upr <- newdat$x[which.min((newdat$yplus-0)^2)]
abline(v=c(lwr, upr), lty=3, col=4)

enter image description here

$\endgroup$
16
  • 1
    $\begingroup$ You could bootstrap this: library(boot); sims <- boot(data.frame(x, y), function(d, i) { fit <- lm(y ~ x, data = d[i,]) -coef(fit)[1]/coef(fit)[2] }, R = 1e4); points(quantile(sims$t, c(0.025, 0.975)), c(0, 0)). For inverse prediction intervals the help file of chemCal:::inverse.predict gives the following reference which might also help deriving a CI: Massart, L.M, Vandenginste, B.G.M., Buydens, L.M.C., De Jong, S., Lewi, P.J., Smeyers-Verbeke, J. (1997) Handbook of Chemometrics and Qualimetrics: Part A, p. 200 $\endgroup$
    – Roland
    Commented Jul 1, 2016 at 10:57
  • 1
    $\begingroup$ What you show in the graph is not the CI for the intercept. You show the points where the lower and upper confidence lines of the predictions cross the axis. $\endgroup$
    – Roland
    Commented Jul 1, 2016 at 11:43
  • 1
    $\begingroup$ Often in linear regression one has a model that says something like this: $$ Y_i = \alpha + \beta x_i + \varepsilon_i \quad \text{where } \varepsilon_1,\ldots\varepsilon_n \sim \text{i.i.d. } N(0,\sigma^2), $$so that the $Y$s are treated as random and the $x$s as fixed. That may be justified by saying you're looking for a conditional distribution given the $x$s. In practice if you take a new sample, it is usually not only the $Y$s but also the $x$s that change, suggesting in some circumstances they should also be considered random. I wonder if this bears upon the propriety of$\,\ldots\qquad$ $\endgroup$ Commented Jul 2, 2016 at 18:24
  • 1
    $\begingroup$ stats.stackexchange.com/search?q="inverse+regression" $\endgroup$
    – whuber
    Commented Jul 3, 2016 at 9:11
  • 1
    $\begingroup$ @AdrienRenaud - It would seem to me that your answer is overly simplistic given the asymmetric aspects that I mentioned, and are highlighted by the bootstrapping exercise that Roland illustrated. If I'm not asking too much, maybe you could expand on the likelihood approach that you mentioned. $\endgroup$ Commented Sep 10, 2016 at 13:54

2 Answers 2

10
+100
$\begingroup$

How to calculate the confidence interval of the x-intercept in a linear regression?

Asumptions

  • Use the simple regression model $y_i = \alpha + \beta x_i + \varepsilon_i$.
  • Errors have normal distribution conditional on the regressors $\epsilon | X \sim \mathcal{N}(0, \sigma^2 I_n)$
  • Fit using ordinary least square

3 procedures to calculate confidence interval on x-intercept

First order Taylor expansion

Your model is $Y=aX+b$ with estimated standard deviation $\sigma_a$ and $\sigma_b$ on $a$ and $b$ parameters and estimated covariance $\sigma_{ab}$. You solve

$$aX+b=0 \Leftrightarrow X= \frac{-b} a.$$

Then the standard deviation $\sigma_X$ on $X$ is given by:

$$\left( \frac {\sigma_X} X \right)^2 = \left( \frac {\sigma_b} b \right)^2 + \left( \frac {\sigma_a} a \right)^2 - 2 \frac{\sigma_{ab}}{ab}.$$

MIB

See code from Marc in the box at How to calculate the confidence interval of the x-intercept in a linear regression?.

CAPITANI-POLLASTRI

CAPITANI-POLLASTRI provides the Cumulative Distribution Function and Density Function for the ratio of two correlated Normal random variables. It can be used to compute confidence interval of the x-intercept in a linear regression. This procedure gives (almost) identical results as the ones from MIB.

Indeed, using ordinary least square and assuming normality of the errors, $\hat\beta \sim \mathcal{N}(\beta, \sigma^2 (X^TX)^{-1})$ (verified) and $\hat{\beta}$'s are correlated (verified).

The procedure is the following:

  • get OLS estimator for $a$ and $b$.
  • get the variance-covariance matrix and extract, $\sigma_a, \sigma_b, \sigma_{ab}=\rho\sigma_a\sigma_b$.
  • Assume that $a$ and $b$ follow a Bivariate Correlated Normal distribution, $\mathcal{N}(a, b, \sigma_a, \sigma_b, \rho)$. Then the density function and Cumulative Distribution Function of $x_{intercept}= \frac{-b}{a}$ are given by CAPITANI-POLLASTRI.
  • Use the Cumulative Distribution Function of $x_{intercept}= \frac{-b}{a}$ to compute desired quantiles and set a cofidence interval.

Comparaison of the 3 procedures

The procedures are compared using the following data configuration:

  • x <- 1:10
  • a <- 20
  • b <- -2
  • y <- a + b*x + rnorm(length(x), mean=0, sd=1)

10000 diferent sample are generated and analyzed using the 3 methods. The code (R) used to generate and analyze can be found at: https://github.com/adrienrenaud/stackExchange/blob/master/crossValidated/q221630/answer.ipynb

  • MIB and CAPITANI-POLLASTRI give equivalent results.
  • First order Taylor expansion differs significantly from the the two other methods.
  • MIB and CAPITANI-POLLASTRI suffers from under-coverage. The 68% (95%) ci is found to contain the true value 63% (92%) of the time.
  • First order Taylor expansion suffers from over-coverage. The 68% (95%) ci is found to contain the true value 87% (99%) of the time.

Conclusions

The x-intercept distribution is asymmetric. It justify a asymmetric confidence interval. MIB and CAPITANI-POLLASTRI give equivalent results. CAPITANI-POLLASTRI have a nice theorical justification and it gives grounds for MIB. MIB and CAPITANI-POLLASTRI suffers from moderate under-coverage and can be used to set confidence intervals.

$\endgroup$
4
  • $\begingroup$ Thanks for this nice answer. Does this method imply that the standard error of the x-intercept is symmetric? The prediction intervals in my figure imply that this is not the case, and I have seen reference to this elsewhere. $\endgroup$ Commented Jul 4, 2016 at 5:35
  • $\begingroup$ Yes, it does imply a symmetric interval. If you want an asymmetric one, you could use a profile likelihood treating your model parameters as nuisance parameters. But it's more work :) $\endgroup$ Commented Jul 4, 2016 at 7:36
  • $\begingroup$ Could you explain more in detail how you get that expression for $(\sigma_X/X)^2$ ? $\endgroup$
    – user83346
    Commented Sep 12, 2016 at 15:51
  • $\begingroup$ @fcop It's a Taylor expansion. Have a look at en.wikipedia.org/wiki/Propagation_of_uncertainty $\endgroup$ Commented Sep 12, 2016 at 16:01
3
$\begingroup$

I would recommend bootstrapping the residuals:

library(boot)

set.seed(42)
sims <- boot(residuals(fit), function(r, i, d = data.frame(x, y), yhat = fitted(fit)) {

  d$y <- yhat + r[i]

  fitb <- lm(y ~ x, data = d)

  -coef(fitb)[1]/coef(fitb)[2]
}, R = 1e4)
lines(quantile(sims$t, c(0.025, 0.975)), c(0, 0), col = "blue")

resulting plot

What you show in the graph are the points where the lower/upper limit of the confidence band of the predictions cross the axis. I don't think these are the confidence limits of the intercept, but maybe they are a rough approximation.

$\endgroup$
1
  • $\begingroup$ Great - this already looks more reasonable than the example from your comment. Thanks again. $\endgroup$ Commented Jul 1, 2016 at 12:22

Your Answer

By clicking “Post Your Answer”, you agree to our terms of service and acknowledge you have read our privacy policy.

Not the answer you're looking for? Browse other questions tagged or ask your own question.