2
$\begingroup$

Lognormal Probability:

2 Part Question for a Newbie:

1.) Assume I have a vector that I suspect is already logNormal (I didn't transform it) and I want to get the mean and variance. From what I understand from reading the wikipedia entry on lognormal distributions, I need to find the mean and the stdev of the normal distribution in order to calculate the mean and variance of the lognormal distribution. Does this mean I have to transform my vector into a normal distribution to get the mean and sigma inputs I will use to calculate the log distribution?

2.) I’m trying to learn how to calculate the probability that the number of units of cars sold will be between x and y assuming the the underlying distribution is lognormal.

here is a sample vector (in R):

cars <- c(4950,2475,2017,917,1100,825,1650,1283,1008,1283,642,550,788,825,715,1082,1118,77    0,605,825)

What I'm looking for is the formula for finding the probability that the units of cars sold will be between, say, 750 and 800. (and if anyone can help me with the R code I would be very grateful).

Thanks!

$\endgroup$

1 Answer 1

4
$\begingroup$

Q1. No, you don't need to treansform your vector. But you do need to test if the lognormal is a good distribution to fit or not.

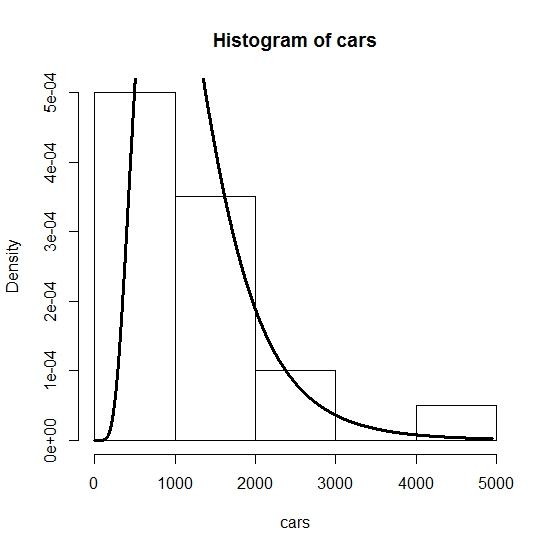
Q2. I will show you how you can assess visually by using a histogram and fit a lognormal distribution (i.e. estimating mean and variance). The required probability is the last line of the code. Here I have plugged in the estimated mean and standard deviation. If you want to find the probability that the number of units of cars sold is less that $z$ then it would be: $$P(X\leq z)=plnorm(z,meanlog=\hat{\mu},sdlog=\hat{\sigma}),$$ where $\hat{\mu}$ and $\hat{\sigma}$ are estimated mean and standard deviation. So $$P(750\leq X\leq800)=P(X\leq 800)-P(X<750).$$ For the log-normal distribution, the analytic formula for the $P(X\leq z)$ is: $$P(X\leq z)=\frac{1}{2}+\frac{1}{2}erf\Big[\frac{\ln(z)-\hat{\mu}}{\sqrt{2}\hat{\sigma}}\Big],$$ where $erf$ is the error function defined in here.

> cars <- c(4950,2475,2017,917,1100,825,1650,1283,1008,1283,642,550,788,825,715,1082,1118,770,605,825)
> require(MASS)
> hist(cars, freq=F)
> fit<-fitdistr(cars,"log-normal")$estimate
> lines(dlnorm(0:max(cars),fit[1],fit[2]), lwd=3)
> fit
  meanlog     sdlog 
6.9806382 0.5162654 
> plnorm(800,meanlog=fit[1],sdlog=fit[2])-plnorm(750,meanlog=fit[1],sdlog=fit[2])
[1] 0.04072665
> 

enter image description here

$\endgroup$
5
  • $\begingroup$ You need an absolute value on your difference because you don't know P(X≤800) > P(X<750) otherwise good answer, I'll leave the +1 and just faith that you will change it... $\endgroup$
    – kpie
    Commented Jul 14, 2016 at 3:19
  • $\begingroup$ Thanks ... But the distribution function is always non-decreasing and right continous ... It means that we always have P(X≤800)>P(X≤750). $\endgroup$
    – Stat
    Commented Jul 14, 2016 at 3:28
  • $\begingroup$ Yikes, my bad... For some reason I thought you were using P(X≤800)-P(X≥750) $\endgroup$
    – kpie
    Commented Jul 14, 2016 at 6:13
  • $\begingroup$ Stat, thanks for the answer. This is really helpful. It it's not too much to ask, how would I go about calculating this probability longhand? That is, what's the formula? Thanks again. $\endgroup$
    – huesecon
    Commented Jul 14, 2016 at 15:24
  • $\begingroup$ I Added the closed form formula in the reply. $\endgroup$
    – Stat
    Commented Jul 14, 2016 at 21:59

Your Answer

By clicking “Post Your Answer”, you agree to our terms of service and acknowledge you have read our privacy policy.

Not the answer you're looking for? Browse other questions tagged or ask your own question.