6
$\begingroup$

What is the practical difference between wilcox.test(x,y, paired=F) and wilcox.test(x~y, paired=F) (i.e. using comma vs. tilde sign) in R, and how to interpret the resulting W-statistic? This should be the same statistical test, but the two methods produce different results.

I have a data frame with 24 rows, each containing information about the sex and the length of an individual:

mydata<-structure(list(ID = 1:24, Sex = structure(c(2L, 2L, 2L, 2L, 2L, 1L, 2L, 1L, 2L, 1L,1L, 2L, 1L, 1L, 2L,2L, 2L, 2L, 1L, 1L,2L, 2L, 2L, 2L), .Label = c("F", "M"), class = "factor"),Length = c(63.8,79.6, 58, 140, 293, 28.6, 147, 31.3, 33.2, 4.55, 16.4, 19.5, 26.4, 3.34, 29.3, 42.9, 55.6, 122, 30.3, 48.4, 130, 64.7, 93.3, 76.1)), .Names = c("ID", "Sex", "Length"), class = "data.frame", row.names = c(NA, -24L))

I want to explore differences in length between the two sexes using Mann-Whitney U test.

Version 1:

wilcox.test(mydata$Length[mydata$Sex == 'M'], mydata$Length[mydata$Sex == 'F'], paired=F)

        Wilcoxon rank sum test

data:  mydata$Length[mydata$Sex == "M"] and mydata$Length[mydata$Sex == "F"]
W = 118, p-value = 0.0003698
alternative hypothesis: true location shift is not equal to 0

Version 2:

wilcox.test(mydata$Length ~ mydata$Sex, paired=F)

        Wilcoxon rank sum test

data:  mydata$Length by mydata$Sex
W = 10, p-value = 0.0003698
alternative hypothesis: true location shift is not equal to 0

They both give me the same P-value, but drastically different W statistics (118 vs. 10). I can't see why this is, or know which one to use for inferences or reporting. Should I not expect to get the same answer from both methods? And how would one go about interpreting the resulting W-statistics?

$\endgroup$
6
  • 1
    $\begingroup$ Typing stats:::wilcox.test.formula will show you how the formula interface is reduced to a call to the default method. $\endgroup$
    – whuber
    Commented Sep 13, 2016 at 18:07
  • $\begingroup$ Because you have not posted a reproducible problem, and a quick test (as well as inspecting the source code) shows the two interfaces produce identical results when used according to the help page, this question has to be considered unclear. Because it appears to focus on using software, it also is not on topic. Please visit our help center for guidance. $\endgroup$
    – whuber
    Commented Sep 13, 2016 at 22:47
  • $\begingroup$ Please give a reproducible example -- i.e. one where we can paste your code in and get the same results you do. $\endgroup$
    – Glen_b
    Commented Sep 14, 2016 at 2:18
  • 1
    $\begingroup$ You're asking us to interpret output ... but not showing any output! (I appreciate a future reader, or potential answerer, who happened to have R installed and available, could run the code you have provided. But it's best not to get the reader to do all the work.) $\endgroup$
    – Silverfish
    Commented Sep 14, 2016 at 12:10
  • 2
    $\begingroup$ I don't know, but running wilcox.test(mydata$Length[mydata$Sex == 'F'], mydata$Length[mydata$Sex == 'M'], paired=F) (i.e. switching the F and the M) produces the same result as the formula call. $\endgroup$
    – jvh_ch
    Commented Sep 14, 2016 at 12:31

1 Answer 1

8
$\begingroup$

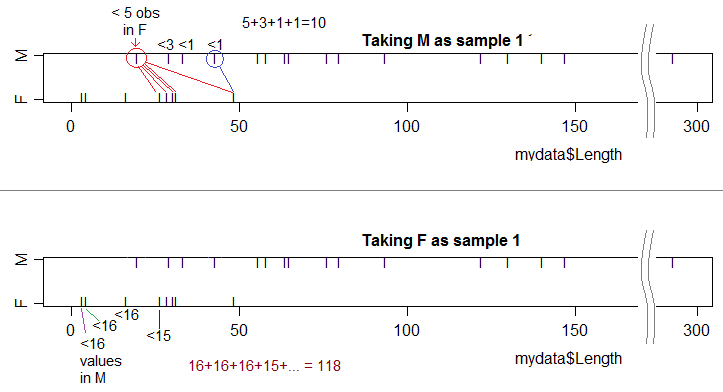
The Mann-Whitney U statistic counts 1 every time an observation in one sample is less than an observation in the other sample, across all cross-sample pairs of observations. However, it's arbitrary which sample is regarded as the first sample and which one is regarded as the second sample -- if you swap them, the sum of the statistics you got each time will be the total number of pairs ($U_1+U_2=n_1 n_2$)

In your case that's 8 x 16 = 128 pairs, so if you swap the two samples and recalculate, the statistic will change from 10 to 128-10 = 118. Either way this is the same distance from the expected value under the null, $E(U) = n_1 n_2/2=64$.

Stripcharts of the two samples, showing calculation of the two statistics

If you think in terms of the Wilcoxon rank sum statistic W (the sum of ranks in sample 1) there's also two possible values depending on which one you call sample 1. However, again they're related to each other in a similar way to the Mann-Whitney statistics above, and indeed they're also related to the Mann-Whitney statistics themselves (by a simple shift).

(R calls its statistic W but subtracts the smallest possible sum of ranks, making it exactly equal to the U statistic.)

The same thing happens when you do a t-test -- you get a different statistic when you look at $\bar{X}-\bar{Y}$ than when you look at $\bar{Y}-\bar{X}$ -- and again they're equally far from what's expected under the null case (in this case, the null case will have expected statistic 0.

$\endgroup$
4
  • $\begingroup$ Thank you @Glen_b, this is very useful. Yes, I now tried swapping the "M" and "F" around in the first code, and indeed got the same answer as with the second version of the code. Also, your explanation was really useful. But then, does reporting the test statistic in papers adds any information to the reader, as opposed to just reporting the P-value? We often hear that we should always report the effect sizes, but here, the number is relative. Any thoughts on that? $\endgroup$
    – Tilen
    Commented Sep 14, 2016 at 13:21
  • $\begingroup$ @Til Clearly with the Wilcoxon-Mann-Whitney where there's several possible statistics, reporting the value is only meaningful if you define the statistic precisely (at least as far as whether it's the sum of ranks, the U-statistic or some other version). Once that's specified (and assuming $n_1$ and $n_2$ have already been stated), it doesn't matter whether you say 10 or 118. An alternative would be to report a Z-statistic along with the raw statistic -- i.e. something of the form $(W-E(W))/\sigma(W)$, which should all be the same (up to a change of sign) no matter which statistic you're using $\endgroup$
    – Glen_b
    Commented Sep 14, 2016 at 19:36
  • $\begingroup$ @Tilen As far as effect sizes go that's tricky for a Wilcoxon Mann Whitney since it depends on what kind of alternatives you're trying to pick up with the test (a location shift, a scale-shift, some measure of change in $P(X>Y)$, ... there are may possibilities). The first there is sometimes of interest, while the third one is the most general. $\endgroup$
    – Glen_b
    Commented Sep 14, 2016 at 19:43
  • $\begingroup$ Thank you @Glen_b. Yes, makes sense. I realise I made a mistake - when I mentioned effect sizes, I had the W-statistic (or U-statistic) in mind, but yes, this is not necessarily the same thing. $\endgroup$
    – Tilen
    Commented Sep 17, 2016 at 17:09

Your Answer

By clicking “Post Your Answer”, you agree to our terms of service and acknowledge you have read our privacy policy.

Not the answer you're looking for? Browse other questions tagged or ask your own question.