16
$\begingroup$

I have collected responses from 85 people on their ability to undertake certain tasks.

The responses are on a five point Likert scale:

5 = Very Good, 4 = Good, 3 = Average, 2 = Poor, 1 = Very Poor,

The mean score is 2.8 and the standard deviation is 0.54.

I understand what the mean and standard deviation stand for.

My question is: how good (or bad) is this standard deviation?

In other words, are there any guidelines that can assist in the evaluation of standard deviation.

$\endgroup$
3
  • $\begingroup$ What would it mean for the SD to be good or bad here? $\endgroup$ Commented Feb 23, 2012 at 4:37
  • 7
    $\begingroup$ It is rather difficult to get such a small SD with data like this: for a mean of 2.8, the SD has to be at least $\sqrt{0.2\times 0.8}=0.4$. (Even if 2.8 represents a rounded value, the SD must still exceed 0.357.) An SD of 0.54 implies that no more than two people could have answered with a 5 (with 21 2's and 62 3's) and not more than six could have answered with a 1 (with 5 2's and 74 3's). This suggests the question may provide exceptionally little information because the scale does not effectively discriminate. $\endgroup$
    – whuber
    Commented Feb 23, 2012 at 15:29
  • $\begingroup$ @whuber excellent data forsensics! But I could also imagine that either he averaged over different questions or did something wrong in his calculations. It seems hard to imagine that people did really respond so uniformly, especially when talking about their supposed abilities. $\endgroup$
    – Erik
    Commented Aug 28, 2012 at 12:45

3 Answers 3

19
$\begingroup$

Standard deviations aren't "good" or "bad". They are indicators of how spread out your data is. Sometimes, in ratings scales, we want wide spread because it indicates that our questions/ratings cover the range of the group we are rating. Other times, we want a small sd because we want everyone to be "high".

For example, if you were testing the math skills of students in a calculus course, you could get a very small sd by asking them questions of elementary arithmetic such as $3+2$. But suppose you gave a more serious placement test for calculus (that is, students who passed would go into Calculus I, those who did not would take lower level courses first). You might expect a lower sd (and a higher average) among freshman at MIT than at South Podunk State, given the same test.

So. What is the purpose of your test? Who are in the sample?

$\endgroup$
1
  • 3
    $\begingroup$ (+1) Just to add a bit to the remark "Standard deviations aren't 'good' or 'bad'" - having a predictor with large standard deviation can be "good" because, in regression, it's inversely related to the standard error of a regression coefficient estimate. On the other hand, if you're concerned with precision of a measurement, then a large standard deviation is "bad". I'm guessing the original poster's interest is closer to the former but it's not clear. $\endgroup$
    – Macro
    Commented Feb 23, 2012 at 13:43
11
$\begingroup$

Short answer, it's fine and a bit lower than I might have expected from survey data. But probably your business story is more in the mean or the top-2-box percent.

For discrete scales from social science research, in practice the standard deviation is a direct function of the mean. In particular, I have found through empirical analysis of many such studies that the actual standard deviation in surveys on 5-point scales is 40%-60% of the maximum possible variation (alas undocumented here).

At the simplest level, consider the extremes, imagine that the mean was 5.0. The standard deviation must be zero, as the only way to average 5 is for everyone to answer 5. Conversely, if the mean were 1.0 then the standard error must be 0 as well. So the standard deviation is precisely defined given the mean.

Now in between there's more grey area. Imagine that people could answer either 5.0 or 1.0 but nothing in between. Then the standard deviation is a precise function of the mean:

stdev = sqrt ( (5-mean)*(mean-1))

The maximum standard deviation for answers on any bounded scale is half the scale width. Here that's sqrt((5-3)(3-1)) = sqrt(2*2)=2.

Now of course people can answer values in between. From metastudies of survey data in our firm, I find that the standard deviation for numeric scales in practice is 40%-60% of the maximum. Specifically

  • 40% for 100% point scales,
  • 50% for 10-point scales and
  • 60% for 5-point scales and
  • 100% for binary scales

So for your dataset, I would expect a standard deviation of 60% x 2.0 = 1.2. You got 0.54, which is about half what i would have expected if the results were self-explicated ratings. Are the skills ratings results of more complicated batteries of tests that are averages and thus would have a lower variance?

The real story, though, is probably the ability is so low or so high relative to other tasks. Report the means or top-2-box percentages between skills and focus your analysis on that.

$\endgroup$
-2
$\begingroup$

If the data is normally distributed, you could see how population is located.

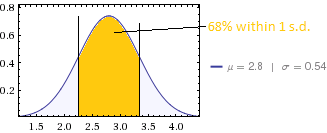
  • 68% of all people lie within 1 standard deviation of the mean (2.26 - 3.34):

enter image description here

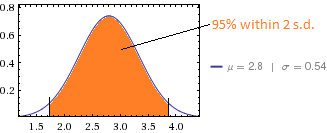
  • 95% of all people lie within 2 standard deviations of the mean (1.72 - 3.88):

enter image description here

It tells you how "spread out" your numbers are.

$\endgroup$
2
  • 2
    $\begingroup$ This answer hasn't been upvoted because it is incorrect: it uses an approximate rule of thumb (as if it were exact) in a case where it is inapplicable. The answer would be true if replaced by the conclusions of Chebyshev's Inequality (which states that at least 75% of the observations lie within two SDs of the mean observation; i.e., at least 75% of the responses are 2's or 3's), but this will not provide much insight. $\endgroup$
    – whuber
    Commented Aug 28, 2012 at 14:22
  • $\begingroup$ Plus, it is only true for truly normally distributed populations. From there, you can calculate the numbers arbitrarily exactly by evaluating the integral over the normal pdf withing the boundaries given by the sd around the mean. Really not helpful here. $\endgroup$
    – Douba
    Commented Mar 17, 2016 at 22:36

Not the answer you're looking for? Browse other questions tagged or ask your own question.