I noticed that I can substantially improve my model's R$^2$ and Residual standard error values by adding some interaction terms.
My model's statistics go from:
Residual standard error: 52.06 on 790 degrees of freedom
Multiple R-squared:  0.5862,    Adjusted R-squared:  0.4773
F-statistic: 5.381 on 208 and 790 DF,  p-value: < 0.00000000000000022
to
Residual standard error: 45.22 on 106 degrees of freedom
Multiple R-squared:  0.9581,    Adjusted R-squared:  0.6057
F-statistic: 2.718 on 892 and 106 DF,  p-value: 0.0000000009271
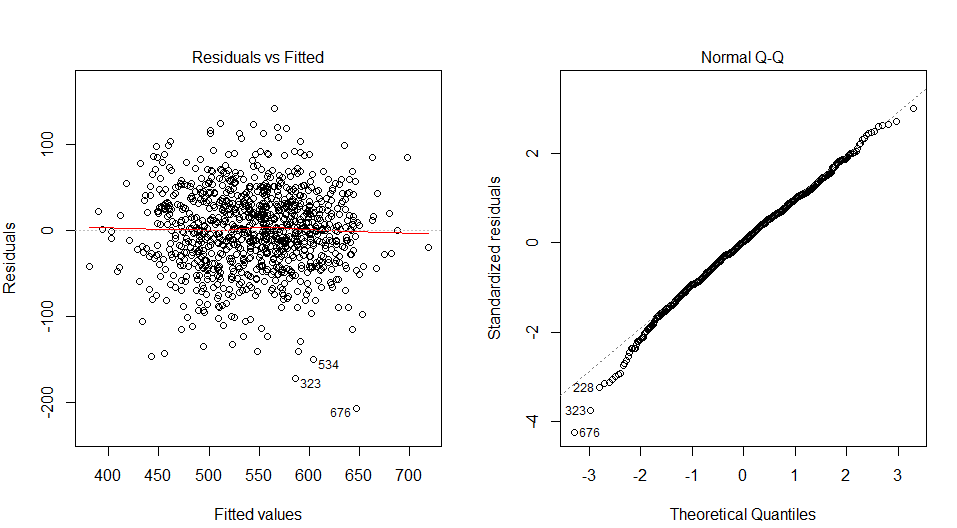
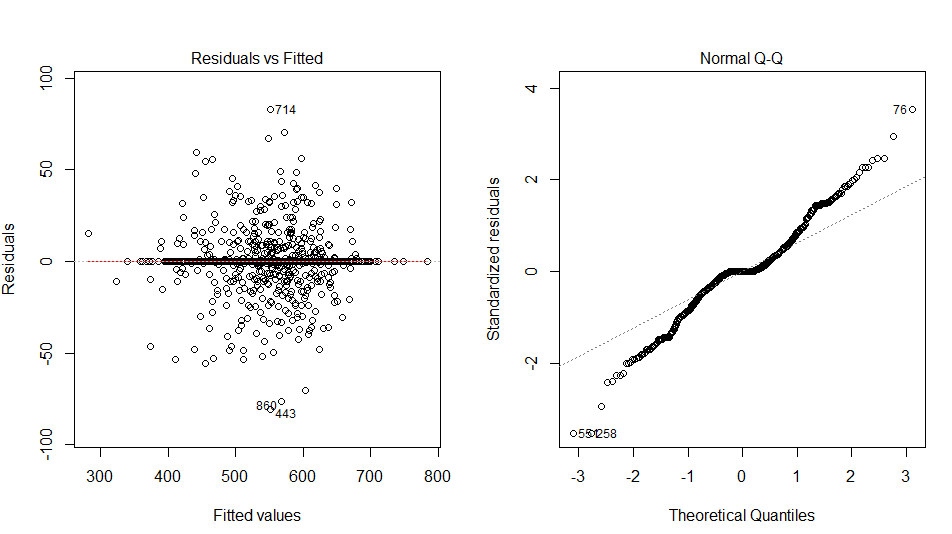
but look what happens to the plots:
from:
to:
tells me that adding the interaction terms is causing something very bad to the model. Or could this signify that actually my data set is e.g. highly non-linear, which is why I would get a "better fit" (according to the summaries above), eventhough the plots start to show more non-linear behaviour?
The reason for believing in "non-linearity" is that:
In linear models I've heard there to be an assumption of the errors having to be normally distributed, that would mean that the QQ-plot should be as close to the straight line as possible. Right? So my thinking of "non-linearity" came from thinking that "linearity assumptions" are violated.
Also, does violating the linearity assumptions reflect to the predictions made on "new data", but not on the data (observations) that's used for the fit? So the reason to take linearity assumptions seriously would be so that the model wouldn't be dependent on the original data set and can work in predicting "future observations"?
How should I balance and interpret these results and what model should I continue to develop, the first one or the second one?


lm(dta$X.U.FEFF..mpist. ~ factor(dta$id)*factor(dta$sukup) + factor(dta$aidink)*factor(dta$id) + factor(dta$aidink)*factor(dta$sukup) + factor(dta$matem)*factor(dta$sukup) + factor(dta$matem)*factor(dta$HISEI) + factor(dta$aidink)*factor(dta$HISEI)). So this model uses only 5 out of 10 variables, since I found the remaining 5 to not be significant. $\endgroup$