0
$\begingroup$

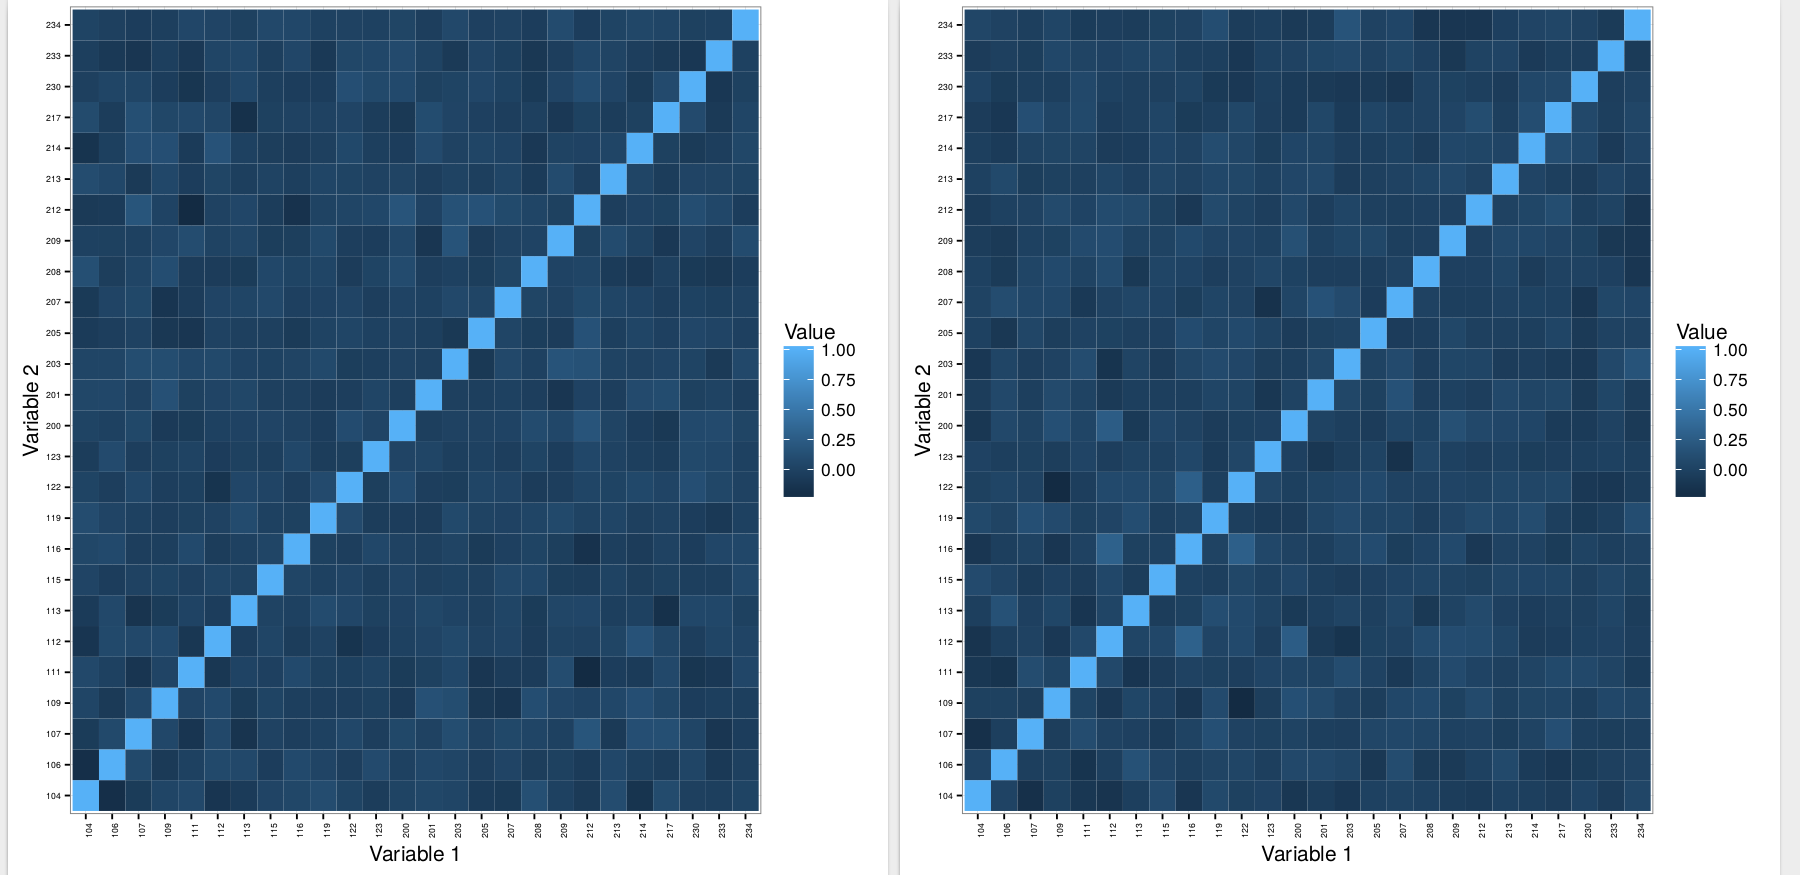
I know the thread Measures of similarity or distance between two covariance matrices, which focuses moustly on L2 norm. My signals are from the L2 vector space, it is guaranteed in Fig. 2. Fig. 1 is then again about the original measurement data. I think two situations here

  1. compare values in Cor matrix where its units come from L2 vector space but have also polynomial description which precise definition is about unknown
  2. compare two Cor matrix where Matrix 1 is from unknown norm, while signals of Matrix 2 come for sure from L2 vector space

I want to know how Cor Matrix 2 is different from Cor Matrix 1. I want to validate both matrices are about the same measurement situation; they are but the detection is better in Fig. 2 but systematic studies not done so not sure. I would like to know how much correlations have decreased and increased between the two matrices.

Fig. 1 Matrix 1 of original signals, Fig. 2 Matrix 2 is about improved detection so much higher detection of details in theory - - but can it be true in statistics?

enter image description here

Example code files it takes the second first column of data in the files

ids <- c(1,2,3,4,5)
# files [, 1] - 1D signals
M <- cor(sapply(files, function(x) x[, 1]))
makeMatrixPlot(M, ids)

makeMatrixPlot <- function(Matrix, ids) {
# http://stackoverflow.com/a/40329062
Matrix %>%
  as.data.frame() %>%
  rownames_to_column(var = "Var1") %>%
  as_data_frame() %>%
  gather(key = Var2, value = Value, -Var1) %>%
  ggplot(
    aes(
      x = reorder(Var1, as.numeric(gsub("V", "", Var1))),
      y = reorder(Var2, as.numeric(gsub("V", "", Var2))),
      fill = Value
    )
  ) +
  scale_x_discrete(labels = ids) +
  scale_y_discrete(labels = ids) +
  geom_tile() +
  theme_bw() +
  theme(
    axis.text.x = element_text(angle = 90, size = 5, hjust = 1),
    axis.text.y = element_text(size = 5)
  ) +
  xlab("Variable 1") +
  ylab("Variable 2")
}

Things already done

  1. Absolute value studies

    • substraction in both directions: A-B and B-A;
    • abs(A - B);
  2. Relative value studies

    • iterated all these with gradient2d with emphasizes the differencens.

      + scale_fill_gradient2()  # http://stackoverflow.com/a/26179065/54964
      

OS: Debian 8.5
Linux kernel: 4.6 backports
R: 3.1.1
Mathematica: 11.0.1
MATLAB: 2016b

$\endgroup$
2
  • $\begingroup$ stats.stackexchange.com/questions/14673/… $\endgroup$
    – Taylor
    Commented Nov 1, 2016 at 21:30
  • $\begingroup$ @Taylor Not enough. The new model follows L2 vector space but it can be described by polynomials. I think some sort of polynomial description of the events could be most descriptive. However, I am not sure how relevant it is with correlation matrices. - - I have also 1D signals which I can study fast because small in size. - - Please, propose any distribution approach and/or related. $\endgroup$ Commented Nov 1, 2016 at 21:33

1 Answer 1

1
$\begingroup$

You could subtract one matrix from the other and make a histogram of the differences.

$\endgroup$
5
  • $\begingroup$ I have done now: substraction in both directions; abs( substraction ); iterated these all with gradient2d with emphasizes the differencens. - - Can you please be more specific about the application of histograms here. $\endgroup$ Commented Nov 1, 2016 at 21:01
  • 1
    $\begingroup$ A histogram may show the differences to systematically not be centered on 0. $\endgroup$
    – dir
    Commented Nov 1, 2016 at 21:15
  • $\begingroup$ Can you please describe about which differences you would describe by histograms? - - Directly cor values? - - I can adjust them by many factors etc by increasing Age so maybe useful by histogram. - - Can you please show a snippet of code, please. $\endgroup$ Commented Nov 1, 2016 at 21:19
  • 3
    $\begingroup$ This is being automatically flagged as low quality, probably because it is so short. At present it is more of a comment than an answer by our standards. Can you expand on it? We can also turn it into a comment. $\endgroup$ Commented Nov 1, 2016 at 22:47
  • $\begingroup$ Turning it into a comment would be fine. $\endgroup$
    – dir
    Commented Nov 23, 2016 at 17:01

Your Answer

By clicking “Post Your Answer”, you agree to our terms of service and acknowledge you have read our privacy policy.

Not the answer you're looking for? Browse other questions tagged or ask your own question.