I am working with many algorithms: RandomForest, DecisionTrees, NaiveBayes, SVM (kernel=linear and rbf), KNN, LDA and XGBoost. All of them were pretty fast except for SVM. That is when I got to know that it needs feature scaling to work faster. Then I started wondering if I should do the same for the other algorithms.
-
$\begingroup$ Related: How and why do normalization and feature scaling work? $\endgroup$– Franck DernoncourtCommented Jan 6, 2017 at 1:23
-
$\begingroup$ Also: Variables are often adjusted (e.g. standardised) before making a model - when is this a good idea, and when is it a bad one? $\endgroup$– Franck DernoncourtCommented Jan 6, 2017 at 1:37
3 Answers
In general, algorithms that exploit distances or similarities (e.g. in the form of scalar product) between data samples, such as k-NN and SVM, are sensitive to feature transformations.
Graphical-model based classifiers, such as Fisher LDA or Naive Bayes, as well as Decision trees and Tree-based ensemble methods (RF, XGB) are invariant to feature scaling, but still, it might be a good idea to rescale/standardize your data.
-
3$\begingroup$ +1. Just note that XGBoost actually implements a second algorithm too, based on linear boosting. Scaling will make a difference there. $\endgroup$ Commented Dec 20, 2016 at 22:11
-
4$\begingroup$ Could you elaborate more about rescaling/standarizing data for RF and XGB? I don't see how it can influence the quality of model. $\endgroup$ Commented May 11, 2017 at 9:27
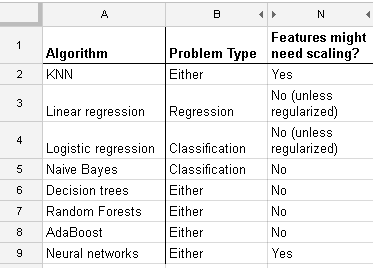
Here is a list I found on http://www.dataschool.io/comparing-supervised-learning-algorithms/ indicating which classifier needs feature scaling:
Full table:
In k-means clustering you also need to normalize your input.
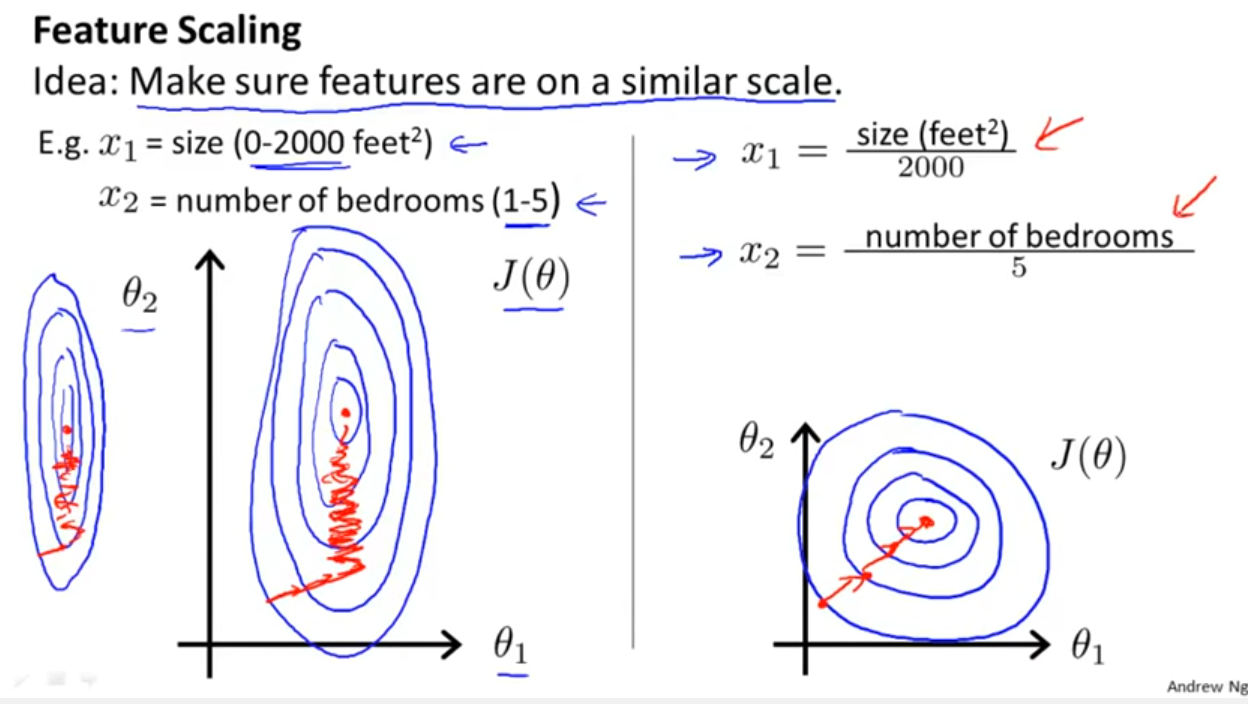
In addition to considering whether the classifier exploits distances or similarities as Yell Bond mentioned, Stochastic Gradient Descent is also sensitive to feature scaling (since the learning rate in the update equation of Stochastic Gradient Descent is the same for every parameter {1}):
References:
- {1} Elkan, Charles. "Log-linear models and conditional random fields." Tutorial notes at CIKM 8 (2008). https://scholar.google.com/scholar?cluster=5802800304608191219&hl=en&as_sdt=0,22 ; https://pdfs.semanticscholar.org/b971/0868004ec688c4ca87aa1fec7ffb7a2d01d8.pdf
-
$\begingroup$ What lacks from this answer is some explication of why!! See my answer for that. $\endgroup$ Commented Jan 1, 2017 at 21:33
-
2$\begingroup$ @kjetilbhalvorsen well I explained for k-means and SGD, but there are many other algorithms and models. There is a 30k-char limit on Stack Exchange :) $\endgroup$ Commented Jan 1, 2017 at 21:36
-
$\begingroup$ Somewhat related: stats.stackexchange.com/questions/231285/… $\endgroup$ Commented Jul 8, 2018 at 17:33
-
$\begingroup$ @FranckDernoncourt Can I ask you a question building on this? I have a dataset of both categorical and continuous data, for which I'm building an SVM. The continuous data is highly skewed (long tail). For transformation on the continuous should I do a
log transformation / Box-Coxand then alsonormalise the resultant data to get limits between 0 and 1? So i'll be normalising the log values. Then calculate the SVM on the continuous and categorical (0-1) data together? Cheers for any help you can provide. $\endgroup$– ChuckCommented Oct 25, 2018 at 10:28
Adding to the excellent (but too short) answer by Yell Bond. Look at what happens with a linear regression model, we write it with only two predictors but the issue do not depend on that. $$ Y_i = \beta_0 + \beta_1 x_i + \beta_2 z_i + \epsilon_i $$ $i=1, \dots, n$. Now if you, say, center and scale the predictors to get $$ x_i^* = (x_i - \bar{x})/\text{sd}(x) \\ z_i^* = (z_i - \bar{z})/\text{sd}(z) $$ and instead fit the model (using ordinary least squares) $$ Y_i = \beta_0^* + \beta_1^* x_i^* + \beta_2^* z_i^* + \epsilon_i $$ Then the fitted parameters (betas) will change, but they change in a way that you can calculate by simple algebra from the transformation applied. So if we call the estimated betas from the model using transformed predictors for $\beta_{1,2}^*$ and the denote the betas from the untransformed model with $\hat{\beta}_{1,2}$, we can calculate one set of betas from the other one, knowing the means and standard deviations of the predictors. The realtionship between the transformed and untransformed parameters is the same as between their estimates, when based on OLS. Some algebra will give the relationship as $$ \beta_0=\beta_0^* - \frac{\beta_1^* \bar{x}}{\text{sd(x)}} -\frac{\beta_2^*\bar{z}}{\text{sd(z)}},\quad \beta_1 =\frac{\beta_1^*}{\text{sd(x)}},\quad \beta_2=\frac{\beta_2^*}{\text{sd(z)}} $$ So standardization is not a necessary part of modelling. (It might still be done for other reasons, which we do not cover here). This answer depends also upon us using ordinary least squares. For some other fitting methods, such as ridge or lasso, standardization is important, because we loose this invariance we have with least squares. This is easy to see: both lasso and ridge do regularization based on the size of the betas, so any transformation which change the relative sizes of the betas will change the result!
And this discussion for the case of linear regression tells you what you should look after in other cases: Is there invariance, or is it not? Generally, methods which depends on distance measures among the predictors will not show invariance, so standardization is important. Another example will be clustering.
-
1$\begingroup$ Can you explicitly show how one calculates one set of betas from the other in this particular example of scalings you have applied? $\endgroup$ Commented Aug 7, 2018 at 2:35
-
$\begingroup$ @kjetil Can I ask you a question building on this? I have a dataset of both categorical and continuous data, for which I'm building an SVM. The continuous data is highly skewed (long tail). For transformation on the continuous should I do a log transformation / Box-Cox and then also normalise the resultant data to get limits between 0 and 1? So i'll be normalising the log values. Then calculate the SVM on the continuous and categorical (0-1) data together? Cheers for any help you can provide $\endgroup$– ChuckCommented Oct 25, 2018 at 10:28
-
1$\begingroup$ Can you please add this as a new question? with reference back here! $\endgroup$ Commented Oct 25, 2018 at 10:31


