2
$\begingroup$

I think I got this, I just want to double check whether I'm interpreting the SPSS output correctly.

So I am running a $2 \times 3$ mixed ANOVA with $3$ between-subject groups and a within-subject factor with $2$ levels. I also run post-hoc tests for the grouping variable (using the Post-Hoc option in the Repeated Measures dialogue box).

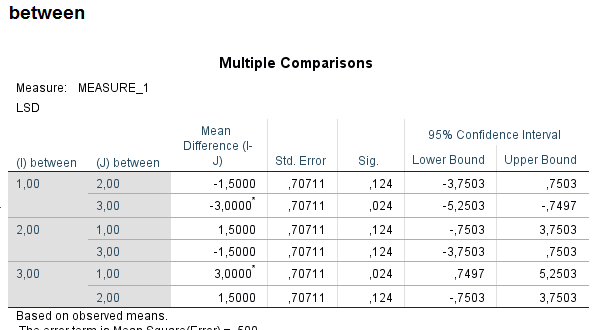
In the output, when it comes to Post Hoc Tests, and it displays a table for multiple comparisons, is it listing comparisons between the marginal means of the groups? So is it elaborating on the main effect of group (if there is any)?

(Just in case I'm not using the expression "marginal mean" correctly, what I mean is that it's contrasting the means of each group collapsing across the two levels of the within subject variable, right?)

$\endgroup$

1 Answer 1

1
$\begingroup$

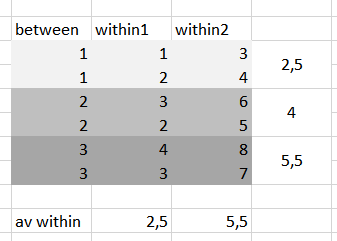
Yes, you are correct. If we consider a simple data frame: enter image description here

Than, post hocs (via Post Hocs menu as well, as via Options -> Compare Main Effects -> Confidence Interval Adjustment) calculate differences in means for main effects (that is, they collapse across levels of other variables:

enter image description here

$\endgroup$
2
  • $\begingroup$ Thank you very much, that was a very helpful demonstration. $\endgroup$
    – waux
    Commented Nov 22, 2016 at 10:40
  • $\begingroup$ happy to help, regards $\endgroup$
    – blazej
    Commented Nov 22, 2016 at 11:27

Your Answer

By clicking “Post Your Answer”, you agree to our terms of service and acknowledge you have read our privacy policy.

Not the answer you're looking for? Browse other questions tagged or ask your own question.