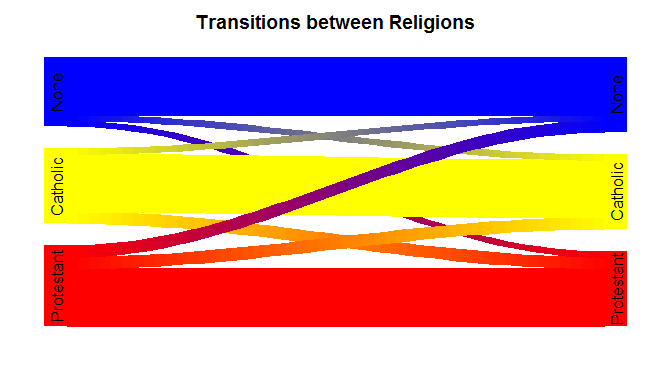
I am working on a project in R using the General Social Survey that charts the numbers of one religious group who convert to another (Catholic $\rightarrow$ Evangelical, Evangelical $\rightarrow$ None, None $\rightarrow$ Catholic, Catholic $\rightarrow$ None, etc.). I'd like to create a graphic representation of this showing the relative sizes of the populations that are making these shifts. Currently I'm using a stacked bar chart but it is difficult to read. Is there a better chart to show the flow of data from one state to another?
code for data set
Region  <- rep(c('Midwest'),9)
RELIG16 <- rep(c('Protestant','Catholic','None'),3)
OutRel  <- rep(c('Protestant'), 3)
OutRel  <- append(OutRel, rep(c('Catholic'),3))
OutRel  <- append(OutRel, rep(c('None'),3))
value   <- rep(c(77.35, 10.25, 18.18),3)
df      = data.frame(Region, RELIG16, OutRel, value)

ggplot(df, aes(x=RELIG16, y=value, fill=OutRel)) + geom_bar(stat="identity") +
  xlab("Original Religious Affilliation") + ylab("Percentage") +
  scale_fill_discrete(name="Conversion\nType",
                  # breaks=c("protestant.prop", "catholic.prop", "none.prop"),
                  labels=c("to Protestant", "to Catholicism", "to None")) +
  ggtitle("Conversion of All Millennials By Region")


Rcode. If you want to know what type of graph is appropriate for a certain type of data, you should ask on Cross Validated (the SE site for statistics, data visualization, etc.). If you wait, we will try to migrate this for you. In the interim, it would help if you could provide a reproducible example. $\endgroup$riverplot$\endgroup$