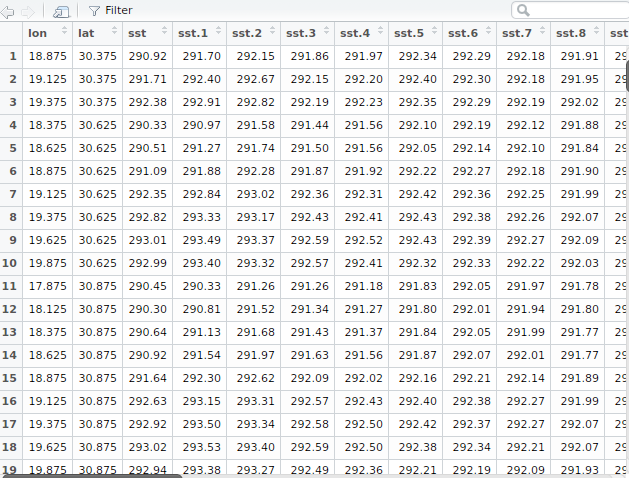
I am using CLARA method to run a cluster analysis of sea surface temperature in the Mediterranean. Temperature daily values are on a regular grid (0.25 degrees grid mesh). Data are stored in monthly files with 30 to 33 columns depending on the month; first two columns are longitude and latitude while the rest stand for the daily SST values, every row representing a lat-lon point.

I have also computed monthly average SST for each point, so there are monthly files with just lon,lat and average SST
>head(datos)
     lon    lat      sst
1 18.875 30.375 291.4571
2 19.125 30.375 291.5510
3 19.375 30.375 291.5977
4 18.375 30.625 291.3013
5 18.625 30.625 291.3635
6 18.875 30.625 291.4942
Please find data sets here (output of dput(datos) is too extensive) for daily values and for monthly average.
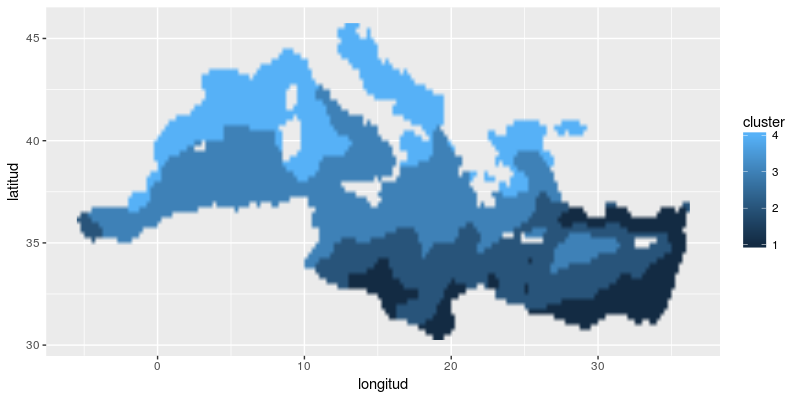
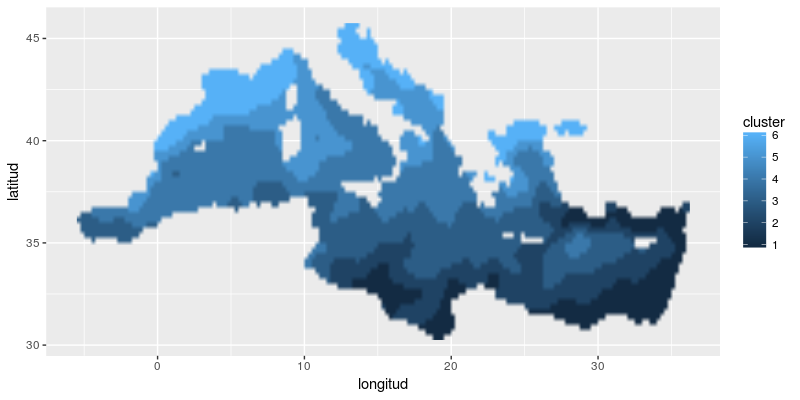
Then I applied CLARA method to both data sets for the same month but get a different optimum number of clusters; 4 clusters were found for the daily values while 6 are found for the monthly average.
Cluster map from daily values (clustering the n daily values as a whole)

Cluster map from average monthly values
 As a meteorologist not expert in statistics I'm not sure the reason for this difference. I "assumed" that average would lead to a more uniform dataset and then, maybe, to a lesser number of clusters. Then, my question is how do I decide which data set is better to run the cluster analysis? daily values monthly aggregated? monthly averaged value?
From a meteorological and oceanographical point of view the monthly averaged map makes more sense to me. Usually, SST to the east of Corsica and Sardinia is higher than in southern France but the example maps are from January and winter SST shows a smooth gradient from north to south so it is possible they are in the same cluster, not usual but possible to some extent.
But as I have monthly files running from 1982 to 2015 I would like to use a robust and objective statistical method to set the optimal number of clusters and then think about their physical significance.
I have run this analysis in R with the following code
library(sp)
library(cluster)
library(ggplot2)

# Path to data
ruta_datos<-"/home/meteo/PROJECTES/VERSUS/TREBALL/"

# List monthly files
files <- list.files(path = ruta_datos, pattern = "SST-mitja")  # For monthly averages
# files <- list.files(path = ruta_datos, pattern = "SST-mitja")  # For daily values

# Run CLARA cluster analysis
for (i in 1:length(files) ) {

datos<-read.csv(paste0(ruta_datos,files[i],sep=""),header=TRUE,na.strings = "NA")

# Subset data to remove longitude and latitude columns, cluster just SST values
x<-datos[3:length(datos)]

# Add lon-lat to the output data cluster
clustdat<-as.data.frame(cbind(datos$lon,datos$lat))
colnames(clustdat)<-c("longitud","latitud")

# Select optimal number of clusters
asw <- numeric(10)
for (k in 4:10) asw[k] <- clara(x, k) $ silinfo $ avg.width
k.best <- which.max(asw)
cat(files[i],"silhouette-optimal number of clusters:", k.best, "\n")

# CLARA cluster analysis
clarasst<-clara(x,k.best,correct.d=TRUE)

# Add CLARA clustering to clustdat
clustdat$cluster<-clarasst$clustering

}

# Visualize map
ggplot(data = clustdat, aes(x = longitud, y = latitud, fill = cluster)) + geom_raster(interpolate = TRUE)
Is this the right way to get the optimal cluster number? Is a monthly SST average as representative as the whole set of daily values? Why are the number of clusters different?
Thanks for your advice
