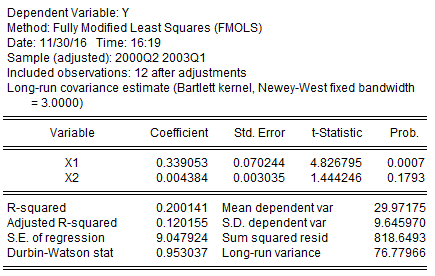
I need to repeat in R results of a fully-modified OLS estimation that I got in Eviews. Here is the Eviews estimation (updated):
My code in R using the cointReg package is:
library(cointReg)
y  <- ts(c(35.8, 41.6, 35.9, 36.9, 42.43, 36.067,28.67, 29.53, 32.83,
           9.867,23.9, 20.8, 21.167),start=c(2000,1),frequency=4)
x1 <- ts(c(149.67,108.89, 89.067, 83.33, 77.2,64.91, 50.2, 48,
           62.13,52.93,43.2, 38.8, 37.9),start=c(2000,1),frequency=4)
x2 <- ts(c(435,675,1033,1180,1293,1380, 1478,
           1580,1710,1800,1865,1920,1997),start=c(2000,1),frequency=4)

cointRegFM(x=cbind(x1[2:13], x2[2:13]), y=y[2:13], bandwidth=3.00, kernel="ba",
           inter=TRUE, deter=NULL, demeaning=TRUE)
And R output:
### FM-OLS model ###

Model:      y[2:13] ~ cbind(x1[2:13], x2[2:13])

Parameters: Kernel = "ba"  //  Bandwidth = 3 ("set by user")

Coefficients:
                             Estimate   Std.Err t value Pr(|t|>0)
cbind(x1[2:13], x2[2:13])   0.4088079 0.0451151  9.0614 3.892e-06
cbind(x1[2:13], x2[2:13]).1 0.0040926 0.0017326  2.3621   0.03981
As you see, the estimation results are quite different. As far as I understand the problem is in some estimation technics that are used by these programs. Do you have any suggestions how to correct the R code and get the same results (or at least similar)?
P.S. I set the bandwidth equal to 3 manually because somehow the Newey West automatic bandwidth gives different results in Eviews and R.

