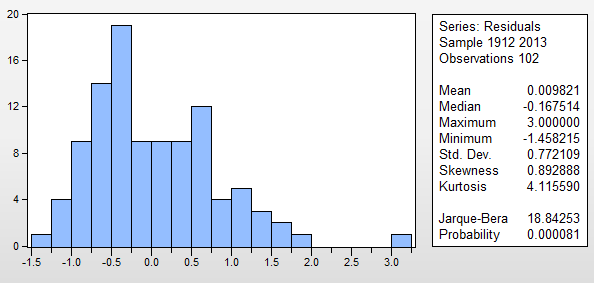
My data is about the number of earthquakes with magnitude greater than or equal to 7 that have occurred from 1912-2013. The Jarque-Bera test shows that the residuals of arima models are not equal. What should I do? I am using E-views to analyze my data. Below is the descriptive stat of ARI(4,1)
1 Answer
From my perspective you have already picked data that tends to be not normal as you are focussing on somewhat extreme cases. How do the residuals look if you include the number of earthquakes of all magnitudes? Additionally you could think about control variables that capture some of the structure in the residuals.
Another thing I would recommend you to do would be a closer analysis in which way the resdiuals deviate from normal. Are the skew? Do they have heavy tails? You can make a time-series plot of your residuals in order to see, whether there is a general structure in your data that your model does not cover. You can create a qqplot in order to look for heavy tails and you can plot a kernel density estimate of your residuals against a normal distribution with $\mu=0$ and $\sigma^2$ equal to the variance of your residuals in order to get some general impression how your residuals deviate.
I you can't get rid of the non-normality of the residuals you still can interpret the parameters but you should be very carefull with making inference and interpreting the p-values.
-
$\begingroup$ Thank you for your answer! I've read that one of the important elements of model diagnostic is to make sure that the residuals of the candidate model are random and normally distributed. So what will be the effect of non-normality in interpreting the results? $\endgroup$– Angel S.Commented Nov 30, 2016 at 8:17
-
$\begingroup$ The main consequence for your analysis is that you cannot trust the p-values and the test-statistics since they are build on the assumption of normality. The data looks somewhat bimodal. Have you already looked at the outlier(s) that have the value greater than 3? $\endgroup$ Commented Nov 30, 2016 at 8:30
-
$\begingroup$ I suppose seismometers have become more sentitive since 1912 so including earthquakes of all magnitudes probably do not make sense. There is no reason to expect a normal distribution in this case, so maybe try a glm ... $\endgroup$ Commented Nov 30, 2016 at 9:20

