5
$\begingroup$

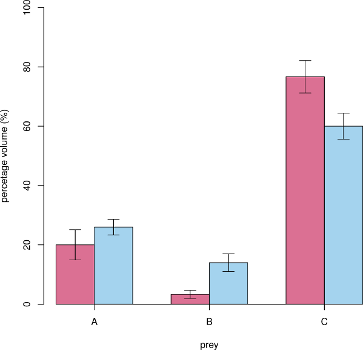
Problem description: I have 14 faecal pellets from 6 bat individuals (3 females, 3 males). All pellets are approximately of equal size. Prey composition (3 types: A, B, C) has been determined by calculating percentage volume of prey item within pellet. My aim is to compare whereas females eat more/less of particular prey than males.

my.data <- data.frame(pellet = seq(1,14,1),
                      individual = rep(c(LETTERS[1:6]), times=c(3,2,4,2,1,2)),
                      group = rep(c("female","male"), times = c(9, 5)),
                      prey.A = c(10,20,40,0,0,20,0,10,80,20,40,40,20,10),
                      prey.B = c(0,0,10,0,0,20,0,0,0,30,30,0,10,0),
                      prey.C = c(90,80,50,100,100,60,100,90,20,50,30,60,70,90))

# --- custom function start--- #
    error.bar <- function(x, y, upper, lower=upper, length=0.1,...){
    if(length(x) != length(y) | length(y) !=length(lower) | length(lower) != length(upper))
    stop("vectors must be same length")
    arrows(x,y+upper, x, y-lower, angle=90, code=3, length=length, ...)
    }
# --- custom function end--- #

# data handling
library(psych)
prey_female <- subset(my.data, group == "female")
prey_male <- subset(my.data, group == "male")
female_data <- c(prey_female$prey.A, prey_female$prey.B, prey_female$prey.C)
mtrx.female <- matrix(female_data,9,3)
female.means <- apply(mtrx.female,2,mean)
female.sd <- apply(mtrx.female,2,sd)
male_data <- c(prey_male$prey.A, prey_male$prey.B, prey_male$prey.C)
mtrx.male <- matrix(male_data,5,3)
male.means <- apply(mtrx.male,2,mean)
male.sd <- apply(mtrx.male,2,sd)
yy <- matrix(c(female.means,male.means),2,3,byrow=TRUE)
ee <- matrix(c(female.sd,male.sd),2,3,byrow=TRUE)*1.96/10

# plot creation
barx <- barplot(yy, beside=TRUE,col=c("palevioletred","lightskyblue2"), ylim=c(0,100),
    names.arg=LETTERS[1:3], axis.lty=1, xlab="prey", ylab="percetage volume (%)")
error.bar(barx,yy,ee)

enter image description here

I have two solutions - but I can not decide which is more appropriate.

First solution is to use Wilcoxon-Mann-Whitney Test to compare medians of both groups. Here is test which compares females and males with respect to prey item A.

library(coin)
wilcox_test(c(prey_female$prey.A,prey_male$prey.A) ~ as.factor(c(prey_female$group, prey_male$group)))
# Asymptotic Wilcoxon-Mann-Whitney Test
# data:  c(prey_female$prey.A, prey_male$prey.A) by
#    as.factor(c(prey_female$group, prey_male$group)) (1, 2)
# Z = -1.1618, p-value = 0.2453
# alternative hypothesis: true mu is not equal to 0

Second solution is to do Chi-squared test.

chisq.test(c(mean(prey_female$prey.A),mean(prey_male$prey.A)), p = c(1/2,1/2), correct = TRUE)
#   Chi-squared test for given probabilities
# data:  c(mean(prey_female$prey.A), mean(prey_male$prey.A))
# X-squared = 0.78261, df = 1, p-value = 0.3763

Data are fabricated, original dataset is much larger. How to make the comparison rigorously? It seems to me that both tests answer the same question.

$\endgroup$
4
  • $\begingroup$ I don't have a straightforward solution to your issue but some thoughts that might simplify the problem. Both tests lead to incorrect results as they assume independence of your observations. Observations are repeated for individuals and thus likely dependent within an individual. You might be able to work around this by first aggregating the data to the individual level. Moreover you may consider leaving one dependent variable out of the analyses. Knowing proportion A and B means that you know the proportion for C. Having all three variables in the analyses doesn't seem to add any information $\endgroup$
    – Niek
    Commented Dec 5, 2016 at 14:35
  • $\begingroup$ This clearly requires a repeated measures analysis / mixed effects model. The difficult part is that your three DVs are percentages and that they depend on each other. Consider this scenario: Males and females eat equal amounts of prey A and prey B, but males also eat an additional amount of prey C. In such a case, you'd get different percentages for males and females although they eat the same amounts of a given prey A or B. Do you have access to data giving the actual amounts (this would require you to estimate the number of pellets excreted)? $\endgroup$
    – Roland
    Commented Dec 6, 2016 at 14:21
  • $\begingroup$ Hi @Roland! Unfortunately, I do not have the number of pellets excreted. Only I can assume that - in reality - the number of pellets should not differ significantly between sexes. Usually the bats are caught, and inserted into cloth bags for 10-15 minuted till they defecate. We can not hold some animals longer/shorter till we get an equal number of pellets for each individual (large stress). Also, such analysis/research has many inherent complications - f.e. some prey although very abundant may be digested fully and there is nothing found in pellets. $\endgroup$ Commented Dec 6, 2016 at 14:36
  • $\begingroup$ I understand. But that means that you have three percentages that sum to 100 as the dependent in addition to a repeated measures dependency structure. I don't know how to best analyze such data, but it's an interesting question. $\endgroup$
    – Roland
    Commented Dec 6, 2016 at 15:01

1 Answer 1

1
+50
$\begingroup$

Since you have multiple pellets for each individual, as Roland mentioned, you have a repeated measure or similar situation. Also as Roland mentioned your diet is not three things but a composite of three percentages (A, B, C) which sum to 100. If I understand what you are trying to do, you'd want to say that if in aggregate:

Bat A,B,C are males had diets averaging say 10%, 0% and 90% (A,B,C) and

Bat D,E,F are females and had diets of say 0%, 90%, and 10% (A,B,C) are they statistically different?

If that is so, then I would look at Cochran's Q test. I recently used it in a PLoS pub to do something similar Performance of three diagnostics. You'd likely set it up blocking differently than I did but I think it would work.

You can read about it here Cochran's Q Wikipedia or Cochran's Q

$\endgroup$

Your Answer

By clicking “Post Your Answer”, you agree to our terms of service and acknowledge you have read our privacy policy.

Not the answer you're looking for? Browse other questions tagged or ask your own question.