3
$\begingroup$

I'm comparing two datasets and want to test the null hypothesis on them. Both datasets contain a lot of meaningful zeros (around 50% of the values are 0). One of them, "test", has more zeros than the other, but the non-zero values are higher. Here are two simplified datasets to illustrate the data that I'm using.

control <- (0, 0, 15, 0, 25, 0, 17, 0, 0, 12, 0)

test <- (0, 0, 0, 0, 30, 0, 19, 0, 0, 20, 0)

I've had trouble figuring out the most appropriate test to use to compare the two datasets, but I've momentarily settled on Mann-Whitney due to the distribution and the high number of zeros (I found some articles saying this test was appropriate for this kind of experiment).

The strange thing that I'm seeing is that occasionally I'll get a significant result, but it appears to be telling me that the group with the lower mean value (zeroes are included when calculating the mean) is actually the group with the smaller sumrank. I even tried checking the rank score for the two datasets manually and found that the one with the higher average mean was lower, as expected. The numbers roughly represent a kind of "revenue per user" number, so I'm definitely looking as average overall revenue as my outcome of interest.

Can anyone help me make sense of the results?? I've also included the R code below that I've ran to discover this (note that the above dataset won't work with the code...that was just a sample)

# This test gives me a p value of .05 when the avg value of test 
# is higher and sumrank is lower

wilcox.test(test, control, paired = FALSE)

# This test gives me a p value of ~.95 with the same dataset
wilcox.test(test, control, paired = FALSE, alternative = 'greater')

I confirmed that the 'greater' alternative works as I'd expect it by running the following code.

# This test gives me a p value of ~0
wilcox.test(test*100, control, paired=FALSE, alternative = 'greater)

Would love any advice that people are willing to give!

$\endgroup$
4
  • $\begingroup$ This procedure neither uses the means nor tests for a difference in means. $\endgroup$
    – whuber
    Commented Dec 8, 2016 at 17:54
  • $\begingroup$ Yes, I understand that. I also checked the sumrank for each group and it, seemingly, is telling me the that the wrong one is smaller. I also suspected, perhaps wrongly, that the test will also typically result in the group with the higher mean having the lower sumrank. It seems I may need another test here, but I'm kind of at a loss! $\endgroup$
    – sam.b
    Commented Dec 8, 2016 at 17:59
  • $\begingroup$ try changing alternative = 'equal' $\endgroup$
    – Jon
    Commented Dec 8, 2016 at 18:35
  • 1
    $\begingroup$ Edited Wilcox to Wilcoxon. The naming of the corresponding function in R saves two characters on each typing with the cost of misinforming many. $\endgroup$
    – Nick Cox
    Commented Mar 21, 2017 at 10:05

2 Answers 2

7
$\begingroup$

This seems rather confused. It isn't clear what you are trying to do, or what the trouble is. Part of the problem is that your example is messed up and doesn't yield the results you report:

control <- c(0, 0, 15, 0, 25, 0, 17, 0, 0, 12, 0)
test    <- c(0, 0,  0, 0, 30, 0, 19, 0, 0, 20, 0)
summary(control)
#   Min. 1st Qu.  Median    Mean 3rd Qu.    Max. 
#  0.000   0.000   0.000   6.273  13.500  25.000 
summary(test)
#   Min. 1st Qu.  Median    Mean 3rd Qu.    Max. 
#  0.000   0.000   0.000   6.273   9.500  30.000 

aggregate(rank(values)~ind, stack(list(test=test, control=control)), sum)
#       ind rank(values)
# 1 control          128
# 2    test          125

From the above, we can see that your example data have the same mean and median in both groups, and that the rank sum is lower for the test group. If I run Mann-Whitney U-tests on these data with your code, I don't get your results:

wilcox.test(test, control, paired=FALSE)
#         Wilcoxon rank sum test with continuity correction
# 
# data:  test and control
# W = 59, p-value = 0.9367
# alternative hypothesis: true location shift is not equal to 0
wilcox.test(test, control, paired=FALSE, alternative='greater')
#         Wilcoxon rank sum test with continuity correction
# 
# data:  test and control
# W = 59, p-value = 0.5631
# alternative hypothesis: true location shift is greater than 0

  1. Moving away from your example, we can ask: What does the Mann-Whitney U-test test?

    The Mann-Whitney tests if one sample is stochastically greater than the other. Imagine your numbers were written on individual raffle tickets and placed in two fishbowls. You will draw one ticket at random from each group. You are testing if it is more likely that one ticket will have a higher number than the other ticket. Note that there are 121 possible pairs of tickets you could draw. Here are the numbers of possible pairings that are greater than, less than, or equal:

    sum(outer(test, control, FUN=">"))   # [1]  31
    sum(outer(test, control, FUN="<"))   # [1]  34
    sum(outer(test, control, FUN="=="))  # [1]  56
    length(test)*length(control)         # [1] 121
    

    These are pretty balanced (as you would expect from the output at the top) so we shouldn't expect a significant result, but there are fewer possibilities where test is greater than control.

  2. Should you use a Mann-Whitney U-test since your data include lots of $0$s?

    The naive, stats 101, scheme is that you should use a t-test to compare two groups unless the data are not normal. If you had enough data, you could probably still use a t-test, despite the non-normality, but what constitutes 'enough' is generally ambiguous. (In your case, it's clear that your data are too non-normal / you have nowhere near 'enough' data to ignore that.) People believe that the Mann-Whitney U-test is a test for differences of means (or maybe medians) with non-normal data, but it's not true.

    The t-test and the Mann-Whitney U-test are testing different null hypotheses. The t-test tests if the samples are drawn from populations with the same mean. The Mann-Whitney U-test checks if one is stochastically greater (as just discussed). You need to use a test that assesses what you are trying to figure out.

  3. What should your null hypothesis be?

    That's really up to you. That is a theoretical decision that precedes data analysis (and hopefully study design).

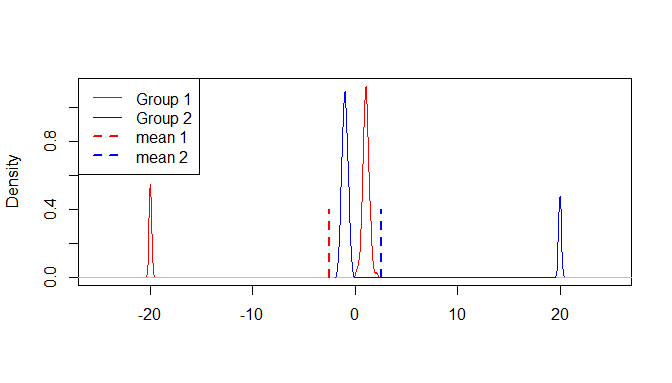
    If your data represent profits from customers, one thing to consider is how many customers you are likely to have. If you will only get one, you might want to determine if one method will likely yield a more profitable customer. On the other hand, it can easily be that the group that is stochastically greater has a lower mean, and if so, with enough customers you would eventually yield greater profits by serving the group with the higher mean (provided you can stay in business long enough):

    enter image description here

  4. How would you test if the means differ?

    You can empirically estimate the sampling distribution by bootstrapping when you cannot assume normality:

    set.seed(997)  # this makes the example exactly reproducible
    B      = 10000
    t.stat = vector(length=B)
    for(i in 1:B){
      bt = sample(test,    size=length(test),    replace=TRUE)
      bc = sample(control, size=length(control), replace=TRUE)
      t.stat[i] = t.test(bt, bc)$statistic
    }
    mean(t.stat>0)    # [2] 0.490047
    2*mean(t.stat>0)  # [2] 0.980094
    

Your p-value is $0.98$, which isn't surprising since your means are identical.

$\endgroup$
4
  • 1
    $\begingroup$ +1. To point #4: another option would be to do a permutation test, using difference in means as a test statistic. In practice this should be pretty close to bootstrapping, but conceptually is somewhat different. $\endgroup$
    – amoeba
    Commented Dec 8, 2016 at 21:29
  • $\begingroup$ @amoeba, that's true, but it assumes that the customers were randomly assigned to the 2 groups. It isn't clear to me if that's the case here. $\endgroup$ Commented Dec 8, 2016 at 21:30
  • $\begingroup$ This is a terrific explanation but without the OP specifying the null hypothesis how can we really know what was intended? $\endgroup$ Commented Dec 8, 2016 at 21:52
  • 2
    $\begingroup$ That's a valid point @MichaelChernick. Moreover, I often find here that an OP can't provide the relevant information even if asked directly, because they are too confused or uninformed on too many issues to even put forward a proper question. My goal is to provide enough information that the OP may be able to figure out where to start. $\endgroup$ Commented Dec 8, 2016 at 21:56
2
$\begingroup$

What hypothesis are you looking to test?

I would recommend trying the Kolmogorov-Smirnov test. It compares the CDF's of the 2 datasets. The null hypothesis is that both groups were sampled from populations with identical distributions. It tests for more deviations from null hypothesis than the Mann-Whitney test - less power to detect shift in the median but more power to detect changes in shape of the distributions.

Also, the means and medians of the 2 data sets you provided are the same.

$\endgroup$
2
  • 2
    $\begingroup$ Again we have another nice formulation of a problem and how to solve it. But I still don't know if this helps the OP because I think we still don't know what was intended. $\endgroup$ Commented Dec 8, 2016 at 21:55
  • $\begingroup$ @MichaelChernick Yes- agreed. Without an objective it's hard to give a real recommendation. $\endgroup$
    – Doc Yall
    Commented Dec 9, 2016 at 14:12

Your Answer

By clicking “Post Your Answer”, you agree to our terms of service and acknowledge you have read our privacy policy.

Not the answer you're looking for? Browse other questions tagged or ask your own question.