4
$\begingroup$

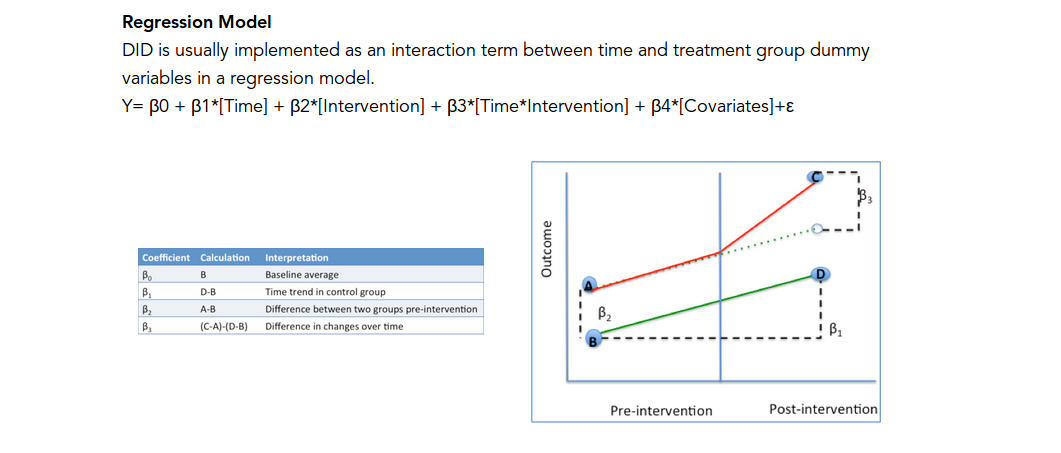
This is often shown as the setup and simple analysis for a difference-in-difference estimation. Lets say that the control series is significantly smaller than the treated series. Below this means the green line would be greatly shifted downward - but still similar trend as red (the primary assumption of d-i-d). Does the (C-A)-(D-B) still work if the outcome value for the series is not close to each other? It seems like we would need to use percentage change.

enter image description here

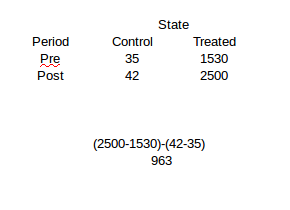
Here is an example. The d-i-d estimate is 963. It doesn't make sense though to me to adjust the increase in the treatment market by the change in the control when the sizes are so different. It seems like a better approach would be to look at the growth in control (20% here) and apply that to the treated: 1.2*1530 and then compare this against the actual of 2500. In this case the estimate would be 664.

It seems like we should compare the treated market growth to the % change in the control market because as is, we remove from the treated increase the absolute value of the control and that seems wrong, since the starting base for the control is so much lower. 7 units is 20% increase for the control, but is very small compared to the treated.

enter image description here

$\endgroup$
9
  • $\begingroup$ A growth rate implies a growth of something (outcome) along time. The DID parameter is obtained from subtracting the A outcome from the C outcome (result 1), subtracting de B outcome from the D outcome (result 2), and then, subtracting result 2 from result 1. Therefore, the unit of measurement needs to be the same for treatment and control (so to compare apples with apples, and not apples with oranges). Why do you think it wouldn't work if the outcome value for the series is not close to each other? Note there is not any calculations involving 'A' and 'D' directly (e.g. 'A-D'). $\endgroup$ Commented Dec 22, 2016 at 2:02
  • $\begingroup$ I added to the question to show an example of what I was troubled by $\endgroup$
    – B_Miner
    Commented Dec 22, 2016 at 2:32
  • $\begingroup$ You added an example, but did not explain why you think results are odd. Why B3 can't be 963, and why 664 makes more sense than 963? $\endgroup$ Commented Dec 22, 2016 at 9:42
  • $\begingroup$ It seems like we should compare the treated market growth to the % change in the control market because as is, we remove from the treated increase the absolute value of the control and that seems wrong, since the starting base for the control is so much lower. 7 units is 20% increase for the control, but is very small compared to the treated. Does that explain? $\endgroup$
    – B_Miner
    Commented Dec 22, 2016 at 13:41
  • $\begingroup$ stats.stackexchange.com/questions/564/… $\endgroup$ Commented Dec 22, 2016 at 15:08

1 Answer 1

4
$\begingroup$

I think the problem is that the "parallel trends" (or parallel paths) assumption here was confused with a "parallel growth" assumption. Two lines are parallel over time when the distance between the two lines remains the same at each point in time. But this is not true when you compute 1.2*1530 (you can easily visualize this).
Instead, the control group increases their outcome by 7 in the second period by going from 35 to 42. The outcome of the treated moves in a parallel fashion only if they also increase their outcome by 7. So the point at the end of the dashed line in your graph for the treated, i.e. the unobserved counterfactual outcome for the treated in the absence of the treatment, should have value 1537. Going from this counterfactual point to the observed point C then yields the solution, 2500 - 1537 = 963.

You raise two very good points though with this question:

  1. Even though we care about parallel trends in a diff-in-diff setting and not so much about the initial difference between the treatment and control groups, this assumption is sensitive to functional form. Whilst the outcome series 35-42 and 1530-1537 are parallel in levels they will NOT be parallel in logs. This leaves scope for people to fish for results. Don't like your diff-in-diff graph? Try logs!
  2. In the very basic specification above the following is not much of a problem. But if you have multiple periods and you want to control for time trends by including dummies and a parametric linear time trend which is specific to the treatment and control groups, this changes the underlying assumptions of the diff-in-diff estimator. See this World Bank post by Jed Friedman and the corresponding paper he refers to. Admittedly this point is a little off-topic but was fitting with the "parallel trends" vs "parallel growth" issue.
$\endgroup$
9
  • $\begingroup$ Hi Andy. So, when we say the D-I-D assumption is parallel trends, we are talking about the same slope (rise/run) and if two markets (or states or whatever) instead have the same growth rate (percentage change) these would not be candidates for D-i-D? $\endgroup$
    – B_Miner
    Commented Dec 23, 2016 at 1:08
  • 1
    $\begingroup$ That's right. This is what the linked paper is about though: developing a class of DiD estimators that can exploit parallel growth rather than parallel paths/trends. $\endgroup$
    – Andy
    Commented Dec 23, 2016 at 5:52
  • $\begingroup$ Andy - are you familiar with Interrupted Time Series analysis? I took this course : edx.org/course/… and it was stated that there are no parallel trends assumptions since it is being modeled explicitly. Curious if you have used this technique as a superior one to d-i-d? $\endgroup$
    – B_Miner
    Commented Dec 23, 2016 at 15:12
  • 1
    $\begingroup$ Meaning if two markets are growing at 20% each period....cant we simply take the log of the response variables and run a normal D-i-D? $\endgroup$
    – B_Miner
    Commented Jan 4, 2017 at 20:18
  • 1
    $\begingroup$ Ok, now I understand. Yes. In this case the log transformed variable will provide linear paths for the treatment and control groups and the difference-in-differences assumption is satisfied. $\endgroup$
    – Andy
    Commented Jan 5, 2017 at 12:54

Your Answer

By clicking “Post Your Answer”, you agree to our terms of service and acknowledge you have read our privacy policy.

Not the answer you're looking for? Browse other questions tagged or ask your own question.