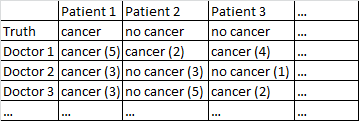
I've got a dataset with the following format.
There's a binary outcome cancer/no cancer. Every doctor in the dataset has seen every patient and given an independent judgment on whether the patient has cancer or not. The doctors then give their confidence level out of 5 that their diagnosis is correct, and the confidence level is displayed in the brackets.
I've tried various ways to get good forecasts out of this dataset.
It works pretty well for me to just average across the doctors, ignoring their confidence levels. In the table above that would have produce correct diagnoses for Patient 1 and Patient 2, although it would have incorrectly said that Patient 3 has cancer, since by a 2-1 majority the doctors think Patient 3 has cancer.
I also tried a method in which we randomly sample two doctors, and if they disagree with each other then the deciding vote goes to whichever doctor is more confident. That method is economical in that we don't need to consult a lot of doctors, but it also increases the error rate quite a bit.
I tried a related method in which we randomly select two doctors, and if they disagree with each other we randomly select two more. If one diagnosis is ahead by at least two 'votes' then we resolve things in favor of that diagnosis. If not, we keep sampling more doctors. This method is pretty economical and doesn't make too many mistakes.
I can't help feeling that I'm missing some more sophisticated way of doing things. For instance, I wonder if there is some way I could divide the dataset into training and test sets, and work out some optimal way to combine the diagnoses, and then see how those weights perform on the test set. One possibility is some sort of method that lets me downweight doctors who kept making mistakes on the trial set, and perhaps upweight diagnoses that are made with high confidence (confidence does correlate with accuracy in this dataset).
I've got various datasets matching this general description, so the sample sizes vary and not all the datasets relate to doctors/patients. However, in this particular dataset there are 40 doctors, who each saw 108 patients.
EDIT: Here is a link to some of the weightings that result from my reading of @jeremy-miles's answer.
Unweighted results are in the first column. Actually in this dataset the maximum confidence value was 4, not 5 as I mistakenly said earlier. Thus following @jeremy-miles's approach the highest unweighted score any patient could get would be 7. That would mean that literally every doctor asserted with a confidence level of 4 that that patient had cancer. The lowest unweighted score any patient could get is 0, which would mean that every doctor asserted with a confidence level of 4 that that patient did not have cancer.
Weighting by Cronbach's Alpha. I found in SPSS that there was an overall Cronbach's Alpha of 0.9807. I tried to verify that this value was correct by calculating Cronbach's Alpha in a more manual way. I created a covariance matrix of all 40 doctors, which I paste here. Then based on my understanding of the Cronbach's Alpha formula $\alpha = \frac{K}{K-1}\left(1-\frac{\sum \sigma^2_{x_i}}{\sigma^2_T}\right)$ where $K$ is the number of items (here the doctors are the 'items') I calculated $\sum \sigma^2_{x_i}$ by summing all the diagonal elements in the covariance matrix, and $\sigma^2_T$ by summing all the elements in the covariance matrix. I then got $\alpha = \frac{40}{40-1}\left(1-\frac{8.7915}{200.7112}\right)=0.9807$ I then calculated the 40 different Cronbach Alpha results that would occur when each doctor got removed from the dataset. I weighted any doctor who contributed negatively to Cronbach's Alpha at zero. I came up with weights for the remaining doctors proportional to their positive contribution to Cronbach's Alpha.
Weighting by Total Item Correlations. I calculate all the Total Item Correlations, and then weight each doctor proportional to the size of their correlation.
Weighting by Regression Coefficients.
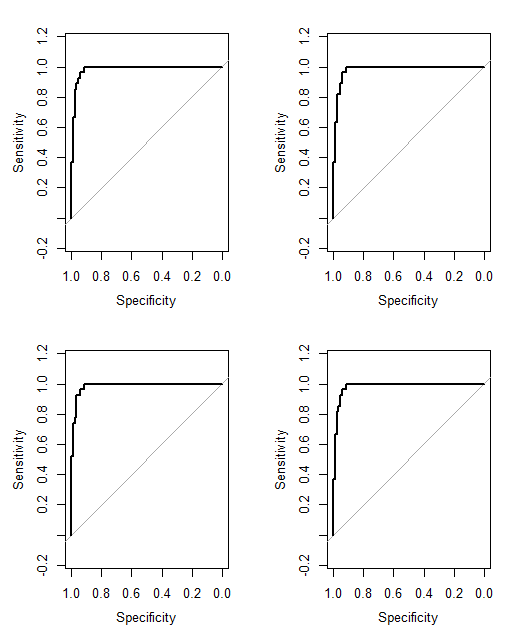
One thing I'm still not sure about is how to say which method is working "better" than the other. Previously I had been calculating things like the Peirce Skill Score, which is appropriate for instances in which there is a binary prediction and a binary outcome. However, now I have forecasts ranging from 0 to 7 instead of 0 to 1. Should I convert all the weighted scores > 3.50 to 1, and all the weighted scores < 3.50 to 0?


No Cancer (3)isCancer (2)? That would simplify your problem a bit. $\endgroup$Cancer (4)to the prediction of no cancer with maximum confidenceNo Cancer (4). We can't say thatNo Cancer (3)andCancer (2)are the same, but we could say there is a continuum, and the middle points in this continuum areCancer (1)andNo Cancer (1). $\endgroup$