53
$\begingroup$

I just browsed through this wonderful book: Applied multivariate statistical analysis by Johnson and Wichern. The irony is, I am still not able to understand the motivation for using multivariate (regression) models instead of separate univariate (regression) models. I went through stats.statexchange posts 1 and 2 that explain (a) difference between multiple and multivariate regression and (b) interpretation of multivariate regression results, but I am not able to tweak out the use of multivariate statistical models from all the information I get online about them.

My questions are:

  1. Why do we need multivariate regression? What is the advantage of considering outcomes simultaneously rather than individually, in order to draw inferences.
  2. When to use multivariate models and when to use multiple univariate models (for multiple outcomes).
  3. Take an example given in the UCLA site with three outcomes: locus of control, self-concept, and motivation. With respect to 1. and 2., can we compare the analysis when we do three univariate multiple regression versus one multivariate multiple regression? How to justify one over another?
  4. I haven't come across many scholarly papers that utilize multivariate statistical models. Is this because of the multivariate normality assumption, the complexity of model fitting/interpretation or any other specific reason?
$\endgroup$
6
  • 23
    $\begingroup$ Separate univariate models ignore correlations. $\endgroup$
    – jwimberley
    Commented Jan 3, 2017 at 0:19
  • 4
    $\begingroup$ Yes there are many phenomena in the world that can't be modeled by independent random variables. $\endgroup$ Commented Jan 3, 2017 at 0:41
  • 4
    $\begingroup$ @jwimberley Could you expand on the consequences of ignoring these correlations in an answer? $\endgroup$ Commented Jan 3, 2017 at 3:13
  • 1
    $\begingroup$ Let me expand a bit more about my question with an example, similar to the UCLA example. Suppose one can measure stress using different heart rate variability signals (such as SDNN, RMSSD, normalized HF, etc.) which are neither formative nor reflective to create a factored measure. Or can measure affect of individuals using items from the circumplex of emotions (such as sadness, happiness, anger, tense, tired, etc.) where again there are different outcomes which may be correlated. Why/how is a multivariate model more informative than a univariate model? $\endgroup$
    – KarthikS
    Commented Jan 3, 2017 at 21:16
  • 5
    $\begingroup$ A simple example of how MANOVA can be beneficial as opposed to ANOVAs: stats.stackexchange.com/questions/129123. An opposite situation where MANOVA is still beneficial but for a different reason: stats.stackexchange.com/questions/61921. So MANOVA can: (i) give more power, (ii) control the overall error rate. $\endgroup$
    – amoeba
    Commented Jan 5, 2017 at 10:42

5 Answers 5

31
+50
$\begingroup$

Be sure to read the full example on the UCLA site that you linked.

Regarding 1:
Using a multivariate model helps you (formally, inferentially) compare coefficients across outcomes.
In that linked example, they use the multivariate model to test whether the write coefficient is significantly different for the locus_of_control outcome vs for the self_concept outcome. I'm no psychologist, but presumably it's interesting to ask whether your writing ability affects/predicts two different psych variables in the same way. (Or, if we don't believe the null, it's still interesting to ask whether you have collected enough data to demonstrate convincingly that the effects really do differ.)
If you ran separate univariate analyses, it would be harder to compare the write coefficient across the two models. Both estimates would come from the same dataset, so they would be correlated. The multivariate model accounts for this correlation.

Also, regarding 4:
There are some very commonly-used multivariate models, such as Repeated Measures ANOVA . With an appropriate study design, imagine that you give each of several drugs to every patient, and measure each patient's health after every drug. Or imagine you measure the same outcome over time, as with longitudinal data, say children's heights over time. Then you have multiple outcomes for each unit (even when they're just repeats of "the same" type of measurement). You'll probably want to do at least some simple contrasts: comparing the effects of drug A vs drug B, or the average effects of drugs A and B vs placebo. For this, Repeated Measures ANOVA is an appropriate multivariate statistical model/analysis.

$\endgroup$
6
  • 3
    $\begingroup$ You gave a great answer. I was definitely aware that there is a world of other examples and arguments that could be made. I like that you took information from the UCLA link to show the OP. Frankly I was initially offended by the question but I decided to provide an answer when I realized that the OP sincerely wanted to here good arguments and was not pushing the idea of ignoring multivariate methods. My choice was to show examples where ignoring correlation had real devastating and fatal results. $\endgroup$ Commented Jan 3, 2017 at 3:09
  • $\begingroup$ Thanks for the great answer, @civilstat. In point 1, if we run two independent univariate models, you have mentioned that the input variable coefficient (for write coefficient for instance) would be correlated and the multivariate model accounts for the same. Here is where I would like to gain more understanding. locus_of_control and self_concept can be merged into a single measure using factor analysis or other techniques and the resultant measure can be modeled, if there is suitable motivation. If both measure two different psyc. phenomena, what do we gain by modeling them simultaneously? $\endgroup$
    – KarthikS
    Commented Jan 3, 2017 at 21:08
  • $\begingroup$ As for the latter justification for point 4, even though repeated measures ANOVA is expressed as a multivariate model in many domains/schools, how about repeated measures MANOVA? Even though 'repeated measures' are a requirement for capturing interdependency between tuples/observations, how about interdependencies between outcomes? $\endgroup$
    – KarthikS
    Commented Jan 3, 2017 at 21:10
  • 2
    $\begingroup$ @ManuelFazio See the next sentence on the UCLA site: "So why conduct a multivariate regression? As we mentioned earlier, one of the advantages of using mvreg is that you can conduct tests of the coefficients across the different outcome variables." If you ran separate regressions, you'd get the same coefficient and SE for each outcome, but you wouldn't get an estimate of the correlation between coefficients across outcomes. You'd need this correlation if, for example, you wanted to get a CI for the difference in coefficients of read for the motivation outcome vs the self_concept outcome. $\endgroup$
    – civilstat
    Commented Apr 27, 2017 at 20:22
  • 1
    $\begingroup$ @civilstat Ah, shame on me, the independence assumption was so ingrained in my mind it didn't click even after I'd read that sentence. Thanks for the extended explanation! $\endgroup$ Commented Apr 27, 2017 at 20:41
12
$\begingroup$

Think about all the false and sometimes dangerous conclusions that come from simply multiplying probabilities, thinking events are independent. Because of all the built-in redundant safeguards, we put into our nuclear power plants experts using the independence assumption told us that the chance of a major nuclear accident was infinitesimal. But as we saw at Three Mile Island, humans make correlated errors especially when they are in a panic because of one initial error which quickly can compound itself. It might be difficult to construct a realistic multivariate model that characterizes human behavior, but realizing the effect of a horrible model (independent errors) is clear.

There are many other examples possible. I will take the Challenger Shuttle disaster as another possible example. The question was whether or not to launch under low-temperature conditions. There was some data to suggest that the o-rings could fail at low temperatures. But there was not a lot of data from past missions to make it clear how high the risk was. NASA has always been concerned with the safety of the astronauts and many redundancies were engineered into the spacecraft and launch vehicles to make the missions safe.

Yet prior to 1986, there were some system failures and near failures probably due to not identifying all possible failure modes (a difficult task). Reliability modeling is a difficult business. But that is another story. In the case of the shuttle, the manufacturer of the o-rings (Morton Thiokol) had done some testing of the o-rings that indicated the possibility of failure at low temperatures.

But the data on a limited number of missions did show some relationship between temperature and failure but because redundancy led some administrators to think multiple o-ring failures would not happen, they put pressure on NASA to launch.

Of course, there were many other factors that led to the decision. Remember how President Reagan was so anxious to put a teacher in space so as to demonstrate that it was now safe enough that ordinary people who were not astronauts could safely travel on the shuttle? So political pressure was another big factor affecting the decision. In this case with enough data and a multivariate model, the risk could have been better demonstrated. NASA use to try to err on the side of caution. In this case, putting off the launch for a few days until the weather warmed up in Florida would have been prudent.

Post-disaster commissions, engineers, scientists and statisticians did a great deal of analysis and papers were published. Their views may differ from mine. Edward Tufte showed in one of his series of books on graphics that good graphics might have been more convincing. But in the end, although these analyses all have merit I think the politics would have still won out.

The moral of these stories is not that these disasters motivated the use of multivariate methods but rather that poor analyses that ignored dependence sometimes lead to gross underestimates of risk. This can lead to overconfidence which can be dangerous. As jwimberley pointed out in the first comment to this thread "Separate univariate models ignore correlations."

$\endgroup$
11
  • 1
    $\begingroup$ Thanks for your wonderful example, @MichaelChernick. The assumption of independence is of concern, I understand. I am more inquisitive about the inter-relationship between outcomes and the need to simultaneously model them. $\endgroup$
    – KarthikS
    Commented Jan 3, 2017 at 21:01
  • $\begingroup$ Let us take the Challenger shuttle disaster example itself. Here the univariate outcome is binary - whether it is safe or not to launch the space shuttle. Consider the model trying to do many things, such as predict safety, measure trajectory deviations and predict indoor pressure for the shuttle. One approach could be to build separate models for each of them, and the other could be to consider to one-for-all model that not only tries to capture the effects of inputs (temeperature, humidity, etc), but also checks the simultaneous effects on the outcomes. $\endgroup$
    – KarthikS
    Commented Jan 3, 2017 at 21:01
  • 1
    $\begingroup$ Thanks @MichaelChernick. I am not sure whether I understand your arguments completely. I understand that many of us use univariate and multivariate regression for simple linear regression with single input and more than one input variable (where simultaneous effects of more than one inputs are examined in which case). But I have framed this question for models with one outcome (univariate) or more than one outcome (multivariate). If the Challenger case does not allude to a multivariate outcome use-case, can you allude to a valid one. Thank you for continuing the discussion. $\endgroup$
    – KarthikS
    Commented Jan 4, 2017 at 17:54
  • $\begingroup$ I am surprised that you have put a bounty on this question. Bounties are more often done when it has received few of no comments and if it contains answers they don't cover some important aspect of the questions. This thread has had three good answers and tons of comments (really good ones too like the first one from jwimberley. $\endgroup$ Commented Jan 5, 2017 at 18:15
  • 1
    $\begingroup$ @Earnest_learner Do any of these groups have a large presence of statisticians. It is unfortunate that so many people not well-trained in statistics think they can do all the statistical work without consulting an expert. This is especially true as software packages make it easier for them to do sophisticated analyses on their own. $\endgroup$ Commented Jan 5, 2017 at 23:56
8
$\begingroup$

Consider this quote from p. 36 of Darcy Olsen's book The Right to Try [1]:

But about sixteen weeks after the [eteplirsen] infusions began, Jenn started noticing changes in [her son] Max. "The kid stopped wanting to use his wheelchair," she says. A few weeks later, he was asking to play outside — something he had not done in years. Then Max started regaining his fine motor skills. He was able to open containers again — a skill he had lost as his [Duchenne muscular dystrophy] had progressed.

Max's mother Jenn is building a coherent picture of his improvement, by pulling together evidence from multiple outcomes that individually might be dismissed as 'noise', but that together are quite compelling. (This evidence synthesis principle is part of the reason pediatricians as a rule never dismiss a parent's instinctive inferences that "something is wrong with my child". Parents have access to a 'multivariate longitudinal analysis' of their kids far richer than the 'oligovariate' cross-sectional analysis accessible to a clinician during a single, brief clinical encounter.)

Abstracting away from the particular case of eteplirsen, consider a hypothetical situation where only a small fraction of study subjects were benefitting from an experimental therapy, let's say because of some shared genetic factor not yet known to science. It's quite possible that for those few subjects, a statistical argument corresponding to Jenn's multivariate story could clearly identify them as 'responders', whereas multiple separate analyses of the faint signals contained in individual outcomes would each yield $p>0.05$, driving a 'null' summative conclusion.

Achieving such evidence synthesis is the core rationale for multivariate outcomes analysis in clinical trials. Statistical Methods in Medical Research had a special issue a few years back [2] devoted to 'Joint Modeling' of multivariate outcomes.

  1. Olsen, Darcy. The Right to Try: How the Federal Government Prevents Americans from Getting the Life-Saving Treatments They Need. First edition. New York, NY: Harper, an imprint of HarperCollins Publishers, 2015.
  2. Rizopoulos, Dimitris, and Emmanuel Lesaffre. “Introduction to the Special Issue on Joint Modelling Techniques.” Statistical Methods in Medical Research 23, no. 1 (February 1, 2014): 3–10. doi:10.1177/0962280212445800.
$\endgroup$
7
$\begingroup$

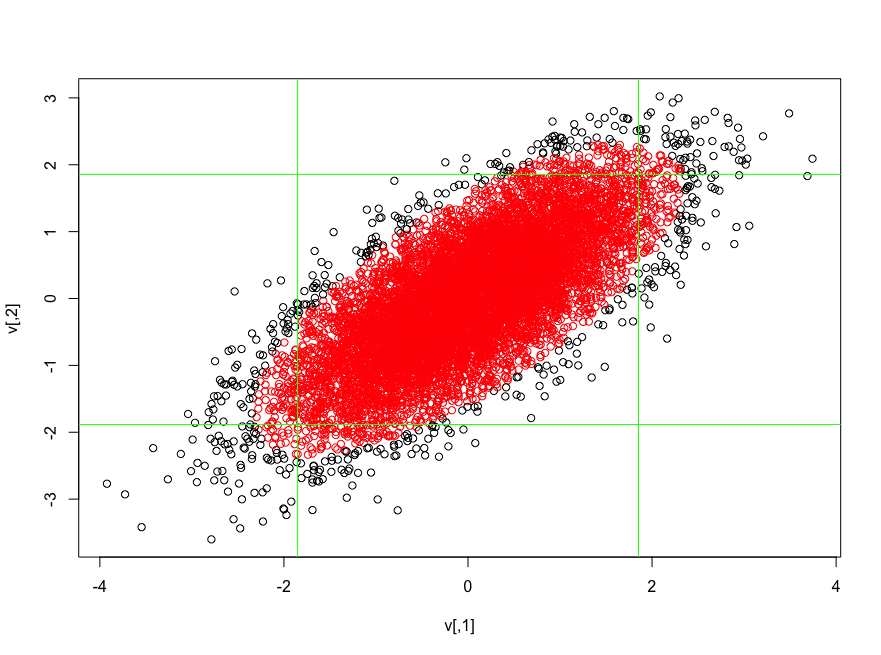
Let's make a simple analogy, since that's all I can really try to contribute. Instead of univariate versus multivariate regression, let's consider univariate (marginal) versus multivariate (joint) distributions. Say I have the following data and I want to find "outliers". As a first approach, I might use the two marginal ("univariate") distributions and draw lines at the lower 2.5% and upper 2.5% of each independently. Points falling outside of the resulting lines are considered to be outliers.

But two things: 1) what do we think of points that are outside of the lines for one axis but inside of the lines for the other axis? Are they "partial outliers" or something? And 2) the resulting box doesn't look like it's really doing what we want. The reason is, of course, the the two variables are correlated, and what we intuitively want is to find outliers that are unusual considering the variables in combination.

In this case, we look at the joint distribution, and I've color-coded the points by whether their Mahalanobis distance from the center is within the upper 5% or not. The black points look much more like outliers, even though some outliers lie within both sets of green lines and some non-outliers (red) lie outside of both sets of green lines.

In both cases, we're delimiting the 95% versus the 5%, but the second technique accounts for the joint distribution. I believe multivariate regression is like this, where you substitute "regression" for "distribution". I don't totally get it, and have had no need (that I understand) to do multivariate regression myself, but this is the way I think about it.

[The analogy has issues: the Mahalanobis distance reduces two variables to a single number -- something like the way a univariate regregression takes a set of independent variables and can, with the right techniques, take into account covariances among the independent variables, and results in a single dependent variable -- while a multivariate regression results in multiple dependent variables. So it's sort-of backwards, but hopefully forwards-enough to give some intuition.]

enter image description here

$\endgroup$
1
  • 2
    $\begingroup$ I like this. I would use the outer ellipses to define the outliers. As I see your illustration a point can be far from the mean in either the x or y direction but still be within an ellipse that is not far from the regression line. $\endgroup$ Commented Jan 11, 2017 at 23:14
1
$\begingroup$

My answer depends on what you want to do with the regression. If you are trying to compare the effect of different coefficients, then regression may not be the right tool for you. If you are trying to make predictions using different coefficients that you have proven are independent, then maybe multiple regression is what you should use.

Are the factors correlated? If so, a multivariate regression can give you a bad model and you should use a method like VIFs or ridge regression to trim cross-correlations. You should not compare coefficients until the cross-correlated factors are eliminated. Doing so will lead to disaster. If they are not cross-correlated, then multivariate coefficients should be as comparable as univariate coefficients, and this should not be surprising.

The outcome might also depend on the software package you are using. I am not joking. Different software packages have different methods for calculating multivariate regression. (Don't believe me? Check out how the standard R regression package calculates R2 with and without forcing the origin as the intercept. Your jaw should hit the floor.) You need to understand how the software package is performing the regression. How is it compensating for cross-correlations? Is it performing a sequential or matrix solution? I've had frustrations with this in the past. I suggest performing your multiple regression on different software packages and see what you get.

Another good example here:

Note that in this equation, the regression coefficients (or B coefficients) represent the independent contributions of each independent variable to the prediction of the dependent variable. Another way to express this fact is to say that, for example, variable X1 is correlated with the Y variable, after controlling for all other independent variables. This type of correlation is also referred to as a partial correlation (this term was first used by Yule, 1907). Perhaps the following example will clarify this issue. You would probably find a significant negative correlation between hair length and height in the population (i.e., short people have longer hair). At first this may seem odd; however, if we were to add the variable Gender into the multiple regression equation, this correlation would probably disappear. This is because women, on the average, have longer hair than men; they also are shorter on the average than men. Thus, after we remove this gender difference by entering Gender into the equation, the relationship between hair length and height disappears because hair length does not make any unique contribution to the prediction of height, above and beyond what it shares in the prediction with variable Gender. Put another way, after controlling for the variable Gender, the partial correlation between hair length and height is zero. http://www.statsoft.com/Textbook/Multiple-Regression

There are so many pitfalls using multiple regression that I try to avoid using it. If you were to use it, be very careful with the outcomes and double check them. You should always plot the data visually to verify the correlation. (Just because your software program said there was no correlation, doesn't mean there isn't one. Interesting Correlations) Always check your results against common sense. If one factor shows a strong correlation in a univariate regression, but none in multivariate, you need to understand why before sharing the results(the gender factor above is a good example).

$\endgroup$
3

Your Answer

By clicking “Post Your Answer”, you agree to our terms of service and acknowledge you have read our privacy policy.

Not the answer you're looking for? Browse other questions tagged or ask your own question.