6
$\begingroup$

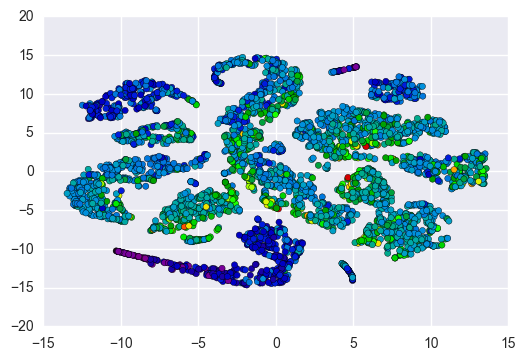
I am using Abalon data for classification from UCI(https://archive.ics.uci.edu/ml/machine-learning-databases/abalone/abalone.data). I have scaled data and used TSNE for visualization.

data=pd.read_csv('http://archive.ics.uci.edu/ml/machine-learning-databases/abalone/abalone.data')
x=data.drop('15', axis=1)
y=data['15']
import matplotlib as plt
mapping={'M':0,'I':1,'F':2}`x['M'].replace(mapping,inplace=True)`
from sklearn.preprocessing import StandardScaler
sc=StandardScalar()
x_scaled=sc.fit_transform(x)
from sklearn.manifold import Isomap,TSNE
sne=TSNE(n_components=2)
x_red_sne=sne.fit_transform(x_scaled)
plt.scatter(x=x_red_sne[:,0],y=x_red_sne[:,1],c=data['15'],cmap='spectral')

Visualization of data in 2D

from sklearn.ensemble import GradientBoostingClassifier
from sklearn.cross_validation import cross_val_score,train_test_split
from sklearn.metrics import classification_report,f1_score

 x_train,x_test,y_train,y_test=train_test_split(x_scaled,y,train_size=.7)
gb=GradientBoostingClassifier(n_estimators=200,learning_rate=.1)
gb.fit(x_train,y_train)
cross_val_score(estimator=gb,X=x_test,y=y_test,scoring='f1_weighted',cv=5)
print classification_report(y_true=y_test,y_pred=gb.predict(x_test))

This model is failing poorly as from the classification report its showing all metrics recall, f1, precision as .23,.22,.24.

I understand its multiclass classification with high class imbalance. What can I do to improve the model?

$\endgroup$
2
  • $\begingroup$ You can consider training with a balanced training set - and then correct this prior probability imbalance afterwards. How to do this, take a look at: stats.stackexchange.com/questions/476911/… $\endgroup$ Commented Jun 5, 2022 at 21:06
  • 1
    $\begingroup$ No this does not represent good statistical practice. $\endgroup$ Commented Aug 9, 2023 at 16:13

3 Answers 3

1
$\begingroup$

In the visualization, each color corresponds to a different output category. If the t-SNE is to be believed, then your categories are rather hard to distinguish; I see lots of colors next to other colors.

This means that your features are not adequate for distinguishing between the categories. In such a case, it might be wise to consider additional features.

Just because you want strong performance on your features doesn’t mean that it is possible. For instance, in the simulation below, the categories have identical distributions on the first two features. If you do not have access to the third feature, you will never reliably separate the categories.


library(MASS)
set.seed(2023)
N <- 100 
r <- 4
y <- rep(seq(1, r, 1), rep(N, r))
M <- MASS::mvrnorm(
    N*r, 
    c(0, 0),
    matrix(c(
        1, 0.7, 
        0.7, 1
    ), 2, 2)
    )
x1 <- M[, 1]
x2 <- M[, 2]
x3 <- runif(
    length(y),
    2*y,
    2*y + 1
)

The x1 and x2 features have the same joint distribution for all levels of the outcome y, so you can never reliably distinguish between categories if you only have those features, no matter how sophisticated of a model you use (not even deep learning on an enormous sample size). However, introducing the x3 feature allows for perfect ability to distinguish between categories, but you need to consider that third feature to have any ability to do so.

It is, however, possible that the t-SNE has removed separability where there is quite a bit. To get at this, there are other ways to think of possible separability on these features.

  1. Could a human reliably distinguish between categories just by looking at the features? For instance, the $784$ pixels of the MNIST digits are enough for a human to distinguish between the digits. If a human can do so reliably with just the given features, then the features contain enough to separate the classes. Otherwise, the features might not.

  2. Have other attempts had luck distinguishing between categories based on these features? If other models have been successful, then it might be that your model is missing something about how the features lead to categories. For a logistic regression, for instance, it might be that an interaction is important, but if you do not specify an interaction term in the regression, the model will not pick up on its importance. Perhaps your model is not flexible enough to use the features effectively.

  3. If others have not worked with your data or similar data, do a bit of exploring. For instance, if you plot some univariate or even bivariate distributions of the features, subsetted by class, consider if there are obvious separations between the classes. If there are, perhaps the t-SNE missed that while working with a high-dimensional space.

$\endgroup$
0
$\begingroup$

Gradient Boosting is a good approach to tackle multiclass problem that suffers from class imbalance issue. In your cross validation you're not tuning any hyper-parameters for GB. I would recommend following this link and try tuning few parameters.

https://www.analyticsvidhya.com/blog/2016/02/complete-guide-parameter-tuning-gradient-boosting-gbm-python/

$\endgroup$
1
  • $\begingroup$ Welcome to Cross Validated! Please take a moment to view our tour. We have a preference that answers are self-contained (but referenced). Please provide the pertinent information from your link in the body of your answer. $\endgroup$
    – Tavrock
    Commented Mar 17, 2017 at 20:46
0
$\begingroup$

Although tuning hyper parameters is always worthwhile, with scores that low, I think you should consider other algorithms. I don't understand the nature of the data, but it could be very heterogeneous (high variance), making it near impossible for some algorithms. I don't see much feature engineering you can do for this specific data, even though that is always a good place to start when trying to get better performance. But ultimately, I can only advise you try some other algos before attempting tuning. Good luck!

$\endgroup$

Your Answer

By clicking “Post Your Answer”, you agree to our terms of service and acknowledge you have read our privacy policy.

Not the answer you're looking for? Browse other questions tagged or ask your own question.