1
$\begingroup$

Consider the following toy data:

All prices have been normalised using $${Price_{Norm} = \frac{Price_{current} - Price_{Min}}{Price_{Max} - Price_{Min}}}$$

Item : Prices
Apples : 0.0, 0.4, 0.8, 1, 0.7
Bread : 0.0, 0.2, 0.4, 0.7, 1.0
Cars : 1.0, 0.6, 0.0, 0.2, 0.1
Wheels : 0.7, 1, 0.7, 0.2, 0.0
Computers: 0.7, 1, 0.3, 0.0, 0.6

At first glance, we can see which items can be seen as being correlated. The price of food went up, and price of automobiles went down.

I can use the mean squared error to find the distances between the items, but is it possible to both sort by the shape and by trend?

Items to the left should have the most upward trend and at the right, downward trends. Similar items (using mean squared error on each point) should be as close to each other as possible.

On this toy data, it is very easy:
Bread, Apples, Computers, Wheels, Cars

But I am lost when trying to do this on hundreds of time-series.

Where should I get started? I am a beginner in these types of problems.

$\endgroup$
1
  • 2
    $\begingroup$ Proper normalization can tricky in general, and it's particularly problematic when it's based on extreme values (max, min) over a set of time-series observations. Extreme values often aren't well enough behaved to serve well for reliable normalization. Please edit your question to say more about what you are trying to accomplish rather than focusing on the approach you are already taking, as there might be much better ways available to address the issues you care about. $\endgroup$
    – EdM
    Commented Mar 19, 2017 at 17:39

2 Answers 2

1
$\begingroup$

You can only sort well by one criterion; you cannot meaningfully sort 2d data.

To sort by your notion of 'trend', I suggest you compute the correlation with a straight upwards line each. I.e. correlation.with 0.0,0.25,0.5,0.75,1.0, then sort all by this score. Cars will have a negative correlation, and thus come late.

$\endgroup$
3
  • $\begingroup$ Is it not possible to sort 2D data or do some kind of abstract representation of it based on a "shape" metric? And correlating with a straight upwards line is problematic as these two data are considered equal, but they are not the same shape in time: 0, 1, 1, 1, 1 and 0, 0, 0, 0, 1 $\endgroup$
    – Bloc97
    Commented Mar 19, 2017 at 17:24
  • $\begingroup$ I'm not suggesting to treat this to be enough. But these two have the same overall trend! The impossibility of ordering 2+ dimensions consistently follows from the inability to order the complex numbers. You can only sort by a derived value such as the sum or the concatenation. $\endgroup$ Commented Mar 19, 2017 at 19:28
  • $\begingroup$ So either you reduce your requirements (e.g. the correlation score I suggested) or you don't expect it to be based on sorting. $\endgroup$ Commented Mar 19, 2017 at 19:30
0
$\begingroup$

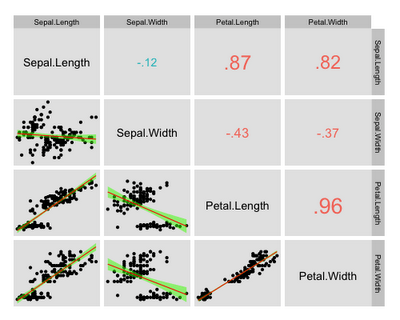
Sorting in 2d can be tricky, but I think if you want to understand the strength and direction of the pairwise correlations, then a scatterplot matrix (SPLOM) might be useful. This R-bloggers post found a nice function called ggcorplot by written by Mike Lawrence that highlights the correlations by color and size opposite the corresponding scatter plots.

enter image description here

https://www.r-bloggers.com/five-ways-to-visualize-your-pairwise-comparisons/

$\endgroup$
1
  • 2
    $\begingroup$ This is generally a good approach, but the question asks about visualising patterns in 'hundreds of time series'. Scatterplot matrices are not practical at that scale. $\endgroup$
    – mkt
    Commented Mar 23, 2018 at 21:24

Your Answer

By clicking “Post Your Answer”, you agree to our terms of service and acknowledge you have read our privacy policy.

Not the answer you're looking for? Browse other questions tagged or ask your own question.