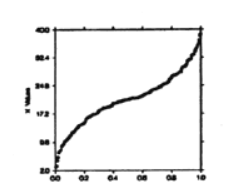
For a multivariate data set, I test normality on the marginals, and I get plots like above.
That's not my actual plot.... mine is not that obvious, the middle part is actually quite straight.... but the sharp decline/rise near the ends is the same as in my plots.
So, what does this tell us. Which model, if not the multivariate normal, should I use?

