I want to analyze my data with linear regression (please see below a subset), but the results do not look realistic and the assumptions are not met. The problem is that I have negative and positive values, I've been struggling trying to find a transformation. I've tried already boxcox,9th root, transformations from package metaphor, transformations mentioned on this post How to transform negative values to logarithms?.
The response variable (Y) is the difference between the proportion of eggs found in a given nest and the expected value of eggs regarding the mean value of the sample; the explanatory variable (X) is the date in which the nest initiated with respect to the population mean.
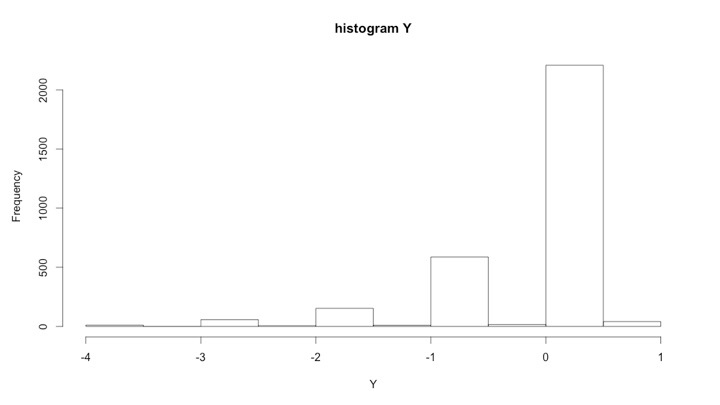
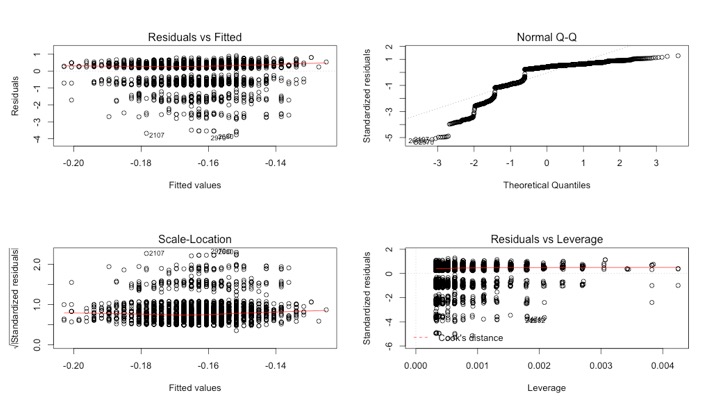
This is how the histogram and the plots of the complete dataset look like:
Is there any other alternative to analyze this data or to transform the response variable?
Thanks a lot!
structure(list(Y = c(0.372463768115942, 0.186231884057971,
-0.813768115942029, -1.75169082125604, 0.372463768115942, 0.248309178743961,
-0.751690821256039, -3.68961352657005, -0.751690821256039, -1.75169082125604,
-1.75169082125604, -0.813768115942029, 0.310386473429952, 0.124154589371981,
0.248309178743961, -1.75169082125604, -0.689613526570048, 0.248309178743961,
-3.68961352657005, 0.372463768115942, 0.248309178743961, -2.62753623188406,
0.248309178743961, 0.310386473429952, 0.124154589371981, -0.751690821256039,
0.248309178743961, 0.186231884057971, 0.310386473429952, 0.248309178743961,
0.248309178743961, 0.186231884057971, -0.875845410628019, 0.248309178743961,
-0.751690821256039, 0.310386473429952, 0.248309178743961, 0.248309178743961,
-2.68961352657005, -0.689613526570048, 0.186231884057971, 0.124154589371981,
0.248309178743961, 0.372463768115942, -1.56545893719807, -0.813768115942029,
-0.751690821256039, -0.689613526570048, -0.689613526570048, 0.372463768115942,
0.372463768115942, -0.751690821256039, 0.248309178743961, -1.75169082125604,
0.310386473429952, 0.248309178743961, -0.627536231884058, 0.310386473429952,
0.248309178743961, -2.62753623188406, -0.627536231884058, 0.248309178743961,
-0.689613526570048, -0.813768115942029, -0.751690821256039, -1.56545893719807,
-0.813768115942029, -0.875845410628019, 0.124154589371981, -0.555128205128205,
0.190659340659341, 0.127106227106227, 0.127106227106227, 0.190659340659341,
0.254212454212454, 0.190659340659341, 0.190659340659341, 0.254212454212454,
-0.745787545787546, 0.317765567765568, 0.317765567765568, 0.381318681318682,
0.381318681318682, -0.682234432234432, 0.254212454212454, 0.317765567765568,
0.317765567765568, 0.254212454212454, 0.190659340659341, 0.127106227106227,
0.127106227106227, 0.190659340659341, 0.254212454212454, -0.745787545787546,
0.127106227106227, 0.254212454212454, -0.745787545787546, 0.127106227106227,
0.317765567765568, 0.190659340659341, 0.381318681318682, -0.809340659340659,
0.317765567765568, -0.745787545787546, 0.254212454212454, -0.745787545787546,
0.127106227106227, 0.127106227106227, 0.190659340659341, 0.254212454212454,
0.127106227106227, 0.190659340659341, 0.254212454212454, 0.254212454212454,
0.381318681318682, 0.190659340659341, 0.127106227106227, 0.254212454212454,
0.190659340659341, -0.809340659340659, 0.254212454212454, 0.190659340659341,
-0.809340659340659, -0.745787545787546, -0.682234432234432, -2.74578754578755,
0.127106227106227, 0.127106227106227, 0.190659340659341, 0.190659340659341,
0.190659340659341, 0.254212454212454, -0.809340659340659, 0.190659340659341,
0.190659340659341, 0.317765567765568, 0.127106227106227, 0.190659340659341,
0.127106227106227, 0.254212454212454, 0.254212454212454, 0.190659340659341,
0.127106227106227, 0.381318681318682, -1.68223443223443, 0.190659340659341,
0.254212454212454, 0.190659340659341, 0.190659340659341, -0.872893772893773,
-0.809340659340659, 0.190659340659341, 0.190659340659341, 0.190659340659341,
0.254212454212454, 0.254212454212454, 0.254212454212454, 0.444871794871795,
0.317765567765568, 0.127106227106227, 0.127106227106227, 0.127106227106227,
0.254212454212454, 0.190659340659341, 0.127106227106227, 0.317765567765568,
0.127106227106227, -0.745787545787546, -0.809340659340659, 0.190659340659341,
-0.745787545787546, 0.190659340659341, 0.127106227106227, -0.847089947089947,
0.152910052910053, 0.267592592592593, 0.152910052910053, 0.191137566137566,
0.191137566137566, 0.191137566137566, 0.229365079365079, 0.267592592592593,
0.229365079365079, 0.0764550264550266, 0.152910052910053, 0.191137566137566,
-3.77063492063492, 0.11468253968254, -0.88531746031746, 0.191137566137566,
0.191137566137566, 0.191137566137566, 0.191137566137566, 0.152910052910053,
0.191137566137566, 0.0764550264550266, 0.152910052910053, 0.267592592592593,
0.191137566137566, 0.191137566137566), X = c(-3, 5, 4, 0,
-1, -1, 0, 0, 0, 0, -1, 0, -2, 0, -2, 0, 0, 0, -1, -3, -1, 2,
-1, -3, 3, 1, 1, 3, 2, 0, -1, -1, 0, -3, 0, -2, -2, -2, 0, -1,
0, 0, -3, -5, -3, 3, -1, 0, -2, -2, -1, -1, -1, 0, -1, -2, -1,
-3, -1, -1, -3, -4, -3, 1, 2, -1, 2, 5, 5, -5.5, 1.5, -0.5, -1.5,
-0.5, 0.5, -0.5, 4.5, -2.5, -1.5, -3.5, -1.5, -3.5, -4.5, -4.5,
-1.5, -2.5, -1.5, -1.5, -0.5, 0.5, -0.5, 4.5, -1.5, 0.5, -0.5,
-1.5, 2.5, 1.5, -3.5, 0.5, -4.5, 3.5, -1.5, 0.5, -0.5, -2.5,
7.5, -0.5, -1.5, 0.5, -1.5, -0.5, -2.5, -2.5, -3.5, 1.5, 0.5,
-0.5, -1.5, 1.5, -1.5, 2.5, 1.5, -1.5, -4.5, 2.5, 0.5, 2.5, -1.5,
3.5, -0.5, -2.5, 1.5, -1.5, -0.5, -3.5, 1.5, -0.5, 1.5, -2.5,
-2.5, 1.5, 3.5, -2.5, 0.5, -1.5, -3.5, -1.5, -1.5, 0.5, 2.5,
2.5, 1.5, 1.5, -0.5, -0.5, -0.5, -5.5, -2.5, 2.5, 1.5, -0.5,
1.5, 3.5, 0.5, -3.5, 0.5, -4.5, 2.5, -2.5, -0.5, 1.5, 0.5, -0.5,
-0.5, -6.5, -1.5, -0.5, -3.5, -2.5, -4.5, -3.5, -5.5, 1.5, -2.5,
-3.5, -2.5, 2.5, 1.5, -1.5, -4.5, -1.5, 0.5, -0.5, -1.5, 0.5,
-0.5, -2.5, -4.5, -4.5)), .Names = c("Y", "X"), row.names = c(NA,
200L), class = "data.frame")
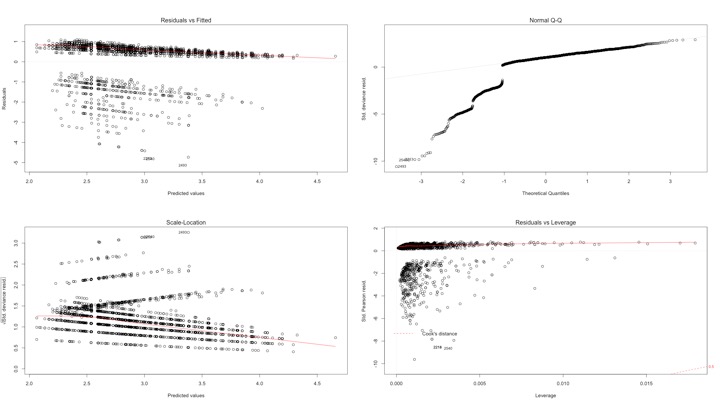
UPDATE: Model gym with offset, poisson:
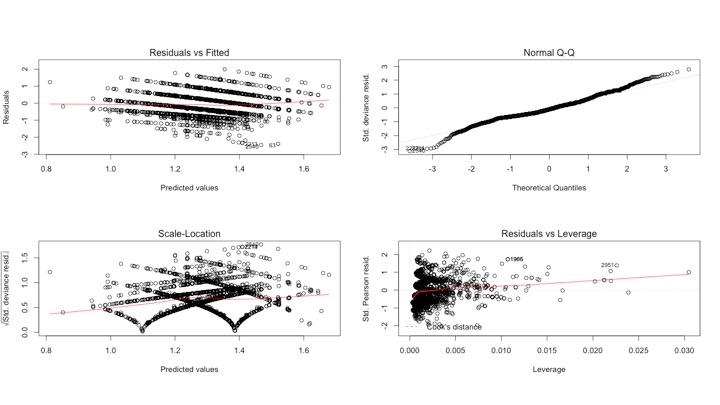
binomial regression with weights for denominator
SOLUTION:


