7
$\begingroup$

I am doing regression task and the response variables in my dataset have a skewed distribution. Say, for the sake of simplicity, that I have a model Y~X and Y(response variable) is in [1,5] but there are many more values in the [4,5] range than the [1,2] range. As a result a majority predictor that predicts 4.5 for Y regardless of the value of X can complete with linear regression if I just look at MSE error.

I am wondering if there is any methodical way to correct MSE to consider this case and maybe penalize the majority predictor more when it gets a Y=1 wrong than when it gets Y=5 wrong. Basically I am looking for a fair error measure for skewed data.

Update: for the sake of simplicity let's say the majority predictor predicts 4.5 for everything regardless of the value of X. My predictor predicts 1 acuratly but always predicts 4.4 for 5's.

the test set for Y is one 1 and the rest are 200 numbers and each equals 5. Based on MSE the majority predictor is better than my predictor but it does not make any sense.

I want to modify MSE to favor accurate predictions for 1's compared to accurate predictions for 5's. Perhaps I can multiply each residual by the inverse of the frequency of the actual Y? also how can I use such an MSE for cases that Y is continuous?

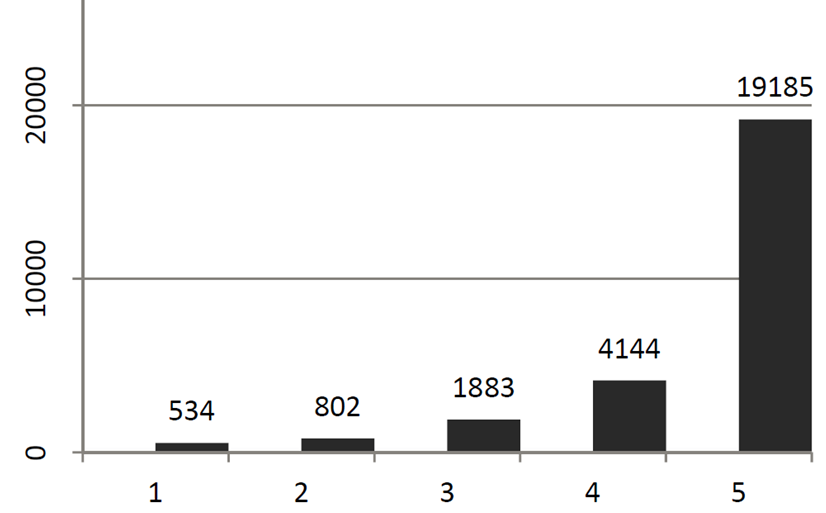
update 2: So some folks suggested that maybe Y should be sampled more properly and I need to find a subsample of my data that provides a uniform distribution of Y. This is not possible in my case. Say I am crawling amazon and most of the ratings that I see are 5 (since amazon removes under performing products) but there are some items with rating 1 as well. Now if I use a majority predictor that predicts 5 everywhere it is going to beat my SVM in terms of MSE value but the majority predictor brings no value to my system. Moreover I do not want to throw out my data just to make the distribution of ratings uniform. I believe it should be one by properly selecting the metric (error measure)

Attached is an example distribution. enter image description here
$\endgroup$
8
  • 4
    $\begingroup$ A very frequently discussed misunderstanding, which might be operating here (search for it), is to suppose that skewness in the responses is a problem. In general, it is not. What matters is the distribution of residuals. What can you say about that? $\endgroup$
    – whuber
    Commented May 9, 2012 at 18:03
  • $\begingroup$ @whuber If he says the response variable Y has a skewed distribution I guess there could be two reasons for it (1) The way he samples in the X space leads to the skewness in Y or (2) he samples in a way that would spread the Ys out but the residuals are highly skewed. In (1) the solution might be to sample more in regions that will fill in the gaps in Y. In the case of (2) a robust regression method could be used such as least absolute value regression which does penalize so heavily for large deviations from the regression line. $\endgroup$ Commented May 9, 2012 at 19:18
  • $\begingroup$ @whuber for the sake of simplicity let's say the majority predictor predicts 4.5 for everything regardless of X and the test set for Y is one 1 and the rest are 200 values each equal to 5. My predictor predicts 1 acuratly but always predicts 4.4 for 5's. Based on MSE the majority predictor is better but it does not make any sense. Hence I want to modify MSE to favor accurate predictions of 1 to accurate predictions of 5's $\endgroup$
    – MarkSAlen
    Commented May 9, 2012 at 21:14
  • $\begingroup$ It sounds like the single case of $Y=1$ is a high-leverage outlier and should be treated as such. $\endgroup$
    – whuber
    Commented May 9, 2012 at 21:31
  • $\begingroup$ @whuber sure but I was trying to construct an extreme example to demonstrate the problem with mse as the error measure. In my dataset number of 5's is 35 times the number of 1's and in fact Y's are continuous and not ordinal. $\endgroup$
    – MarkSAlen
    Commented May 9, 2012 at 21:59

2 Answers 2

3
$\begingroup$

One possible pragmatic response is inspired by the motivation behind the logit transformation used in logistic regression. In that situation, the original response is constrained between 0 and 1 and hence treating it as though it has a normal distribution causes all sorts of problems. Part of the response is to transform by log(y/(1-y)), where y is the modelled response.

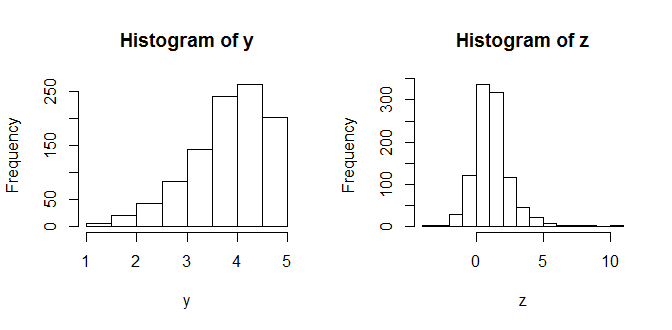
Your problem is comparable, just that the limits are 1 and 5 rather than 0 and 1. If you want to analyse your data using methods motivated by Normal-distribution assumptions (into which I would categorise use of squared errors), you could consider transforming it on to a scale with no upper or lower bounds as below (in R, but the code should make sense if you're not familiar with it; the key line is the one that creates the "z" variable from the original "y"):

# generate some skewed data in the [1,5] space:
y <- rnorm(1000,4,1)
y[y<1] <- runif(sum(y<1),1,3)
y[y>5] <- runif(sum(y>5),3.5,5)

# transform it similar to logit transform
z <- log((y-1)/4 / (1-(y-1)/4))

# plot the results
par(mfrow=c(1,2))
hist(y); hist(z)

enter image description here

The new z variable is much more suited for OLS or whatever other similar techniques you might want to try.

$\endgroup$
1
$\begingroup$

If I understand correctly, the problem you are facing is that by using MSE you are developing a poor predictor. This is a common issue on skewed-population problems. For example, if you were trying to predict if a person has cancer or not (binary) in a popluation where 99% of people dont have cancer, by analyzing a routine blood exam, a model trained by minimizing MSE would say that nobody has cancer, and would by 99% precise.

One way to address this issue is to use Fscore instead of Precision, or MSE. Fscore is an error metric that uses both Precision and Recall. http://en.wikipedia.org/wiki/F1_score

I learnt this in Andrew Ng's Machine Learning Course on Coursera. Here is a video of the specific class on error metrics for skewed classes. http://www.youtube.com/watch?v=uj605bVFH8Y

Hope this helps!

$\endgroup$

Your Answer

By clicking “Post Your Answer”, you agree to our terms of service and acknowledge you have read our privacy policy.

Not the answer you're looking for? Browse other questions tagged or ask your own question.