2
$\begingroup$

I am solving the following problem:

An electronic tablet producer claims that the batteries on their tablets lasts for 10 hours but from my experience I think it is less than that. It is known that the battery life-span follows an exponential distribution. A random sample of size 100 (supposed to be independent) is tested, for which the mean battery life is found to be 9 hours. Test whether the producer's claim is true at a 5% significance level using the critical value method.


My Work

We can model the $i$th tablet battery life-span as $X_i \sim Exp(\lambda)$ where the lifespan is measured in hours. Each $X_i$ has mean $\dfrac{1}{\lambda}$ and standard deviation $\dfrac{1}{\lambda}$. A sensible estimator of $\mu = \dfrac{1}{\lambda}$ is then just $\bar{X}_n$.

The null hypothesis is $H_0 : \mu = 10 = \dfrac{1}{\lambda}$,

and the alternative hypothesis is $H_1 : \mu = \dfrac{1}{\lambda} < 10$.

The appropriate test statistic is $Z = \dfrac{\bar{X}_n - \mu}{\dfrac{\sigma}{\sqrt{n}}} = \dfrac{\bar{X}_n - 10}{\dfrac{10}{\sqrt{100}}}$

Assuming the sample size is large enough for the CLT to apply, we can get our observed test statistic::

$Z = \dfrac{9 - 10}{\dfrac{10}{10}} = -1$

I now calculate the critical value at a 5% level of significance:

$P(z > z_{0.05}) = 0.05$

$\implies 1 - P(z < z_{0.05}) = 0.05$

$\implies 0.95 = P(Z < Z_{0.05})$

$\implies Z_{0.05} = 1.64$

This is my point of confusion: How do I deal with the negative value for $Z$ (the test statistic)? When doing these types of problems, I have always derived a positive value for the test statistic, so I'm unsure of how to proceed.

I would greatly appreciate it if people could please take the time to explain what one does (and why) when they derive a negative value for the test statistic, as done above.

EDIT:

My understanding is that, when hypothesis testing using the critical value method, we are seeking to reject the null hypothesis if it falls inside an arbitrary interval along the tails of the standard normal distribution, based on the indicated level of significance. When we calculate the test statistic, $Z$, we get a value of $-1$. This is the same $Z$ that is used in calculating quantiles: $P(Z > a_\alpha) = \alpha$. The numerical value of $Z$ for quantiles is irrelevant, but the sign (+ or -) IS relevant. Therefore, we have, in this case, that $P(-Z > a_{0.05}) = 0.05$, which implies that $P(Z < -a_{0.05}) = 0.05$. After doing further simple calculations, we find that $P(Z < a_{0.05}) = 0.95$; therefore, $a_{0.05} = 1.64$.

Now, since we want to reject the null hypothesis if the test statistic is on the tails of the standard normal distribution (too unlikely in either direction), we reject values that are $< -1.64$ or $> 1.64$?

$\endgroup$
14
  • 2
    $\begingroup$ Right after you state your alternative, try stating whether you should reject the null for very large values of $\hat\mu$, for very small values of $\hat\mu$ (or for both very large and small) ... that is, state the nature of your rejection region. Then when you move to a normal approximation, draw yourself a normal density and shade in the tail corresponding to the region you;should reject for. THEN actually do the test, starting with a formal rejection rule. $\endgroup$
    – Glen_b
    Commented Jun 10, 2017 at 5:42
  • $\begingroup$ @Glen_b thanks for the response. Please see my comment to the_Ship_of_Fools' answer; is that what you were alluding to? $\endgroup$ Commented Jun 10, 2017 at 7:14
  • 1
    $\begingroup$ You seem to have completely ignored the part where I said: "Right after you state your alternative, try stating whether you should reject the null for very large values of μ^, for very small values of μ^ (or for both very large and small)" ... and as a result, you went awry (again). .. Look at your alternative hypothesis gain and do that very basic thing I suggested. $\endgroup$
    – Glen_b
    Commented Jun 10, 2017 at 9:55
  • $\begingroup$ @Glen_b Based on the alternative hypothesis ($\mu < 10$), I would say that we should reject the null hypothesis in favour of the alternative hypothesis for values of $\mu < 10$? $\endgroup$ Commented Jun 10, 2017 at 12:46
  • 1
    $\begingroup$ consider that this assertion: "We're looking for the value such that the test statistic is in the 95 percentile" does not correctly capture what we want. I believe I now see something of both the specific kind and magnitude of your misconception and may be able to write an answer. I didn't until now realize how far back the misunderstanding was. $\endgroup$
    – Glen_b
    Commented Jun 12, 2017 at 3:21

3 Answers 3

1
$\begingroup$

Let's consider what we're trying to do at a very basic level.

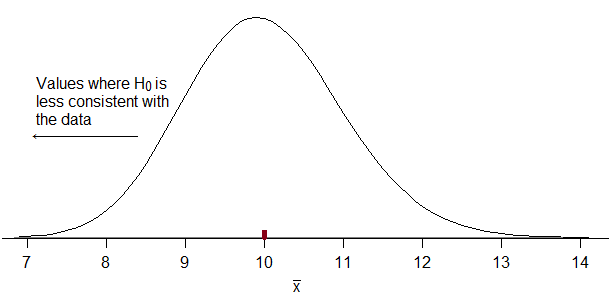
Here's the actual density of the average lifespan of 100 batteries under the null. It's somewhat skew but will be not-too-terribly approximated by a normal:

density for gamma with shape 100 and mean 10

If the manufacturer's batteries don't last as long as claimed, we should see a lower average than 10. So we want to reject when our estimate of $\mu$ ($\hat \mu = \bar{x}$) -- i.e. the sample mean -- is sufficiently far below 10 that $\mu=10$ isn't a tenable claim.

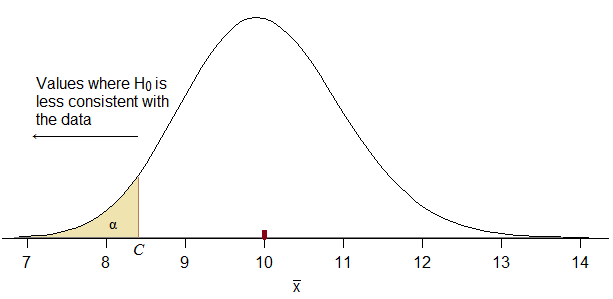
Consequently, our rejection rule must correspond to something of the form "reject for $\hat \mu \leq C$" for some suitable choice of $C$. If we don't get that we clearly made a mistake.

How do we choose $C$? We want $C$ to be as high as possible (i.e. close to $10$ from below, so that we maximize power) while keeping the probability of falling in the rejection region when $H_0$ is true to be no more than $\alpha$:

Same density with a rejection region marked in the left tail; it has area alpha and the upper boundary of the region is C

When you use a normal approximation for this, you still want it to correspond to rejecting small values of $\bar{x}$. If you don't do that, it won't correspond to your stated alternative hypothesis (potentially leaving you in the silly position of accusing the manufacturer of shorter battery life when maybe it's actually longer).

Can you figure out what the $Z_C$ value would be below which $\alpha$ of the probability will lay? (under $H_0$, naturally)

(If you use a calculation approach that yields a $Z_C$ that doesn't look qualitatively like the diagram, you cannot be using the right one. Instead just do the basic calculation the diagram indicates. This is the sort of diagram you should have been drawing for us -- such diagrams are crucial to avoiding errors. I really don't know how they can be letting you try to answer questions like this without insisting you draw a diagram every time.)

What rejection region for $\bar{x}$ would it imply?

(If you use a normal approximation, the actual type I error rate for a nominal 5% test turns out to be 4.35%, which is perhaps a bit further out than many people would hope, but that's hardly the big issue here -- much more important is figuring out the right direction for rejecting the null)

$\endgroup$
2
  • $\begingroup$ Thank you very much for the elaborate response. I think I understand now. So after we convert $\bar{x}$ to the standard normal distribution (this is our test statistic, right?), the part of the diagram that's highlighted, $\alpha$, becomes $-1.64 <$, the 10 becomes -1? (or is it 0?), and 1.64 would be above -1 (or is it 0?). Therefore, from the diagram, we would see that the 1.64 that we deduced in our calculations is actually implying a LONGER battery life than the manufacturer's claimed mean? Does this all seem correct to you? $\endgroup$ Commented Jun 12, 2017 at 5:20
  • $\begingroup$ No, $\alpha$ is your significance level and corresponds to the area (which is why it's within the region in the diagram, not at the boundary of it). Don't confuse the critical value with the area below it. Rather than pepper guesses at me and hoping I'll confirm one of them, write a probability statement from the diagram, and then transform it via algebraic steps into a statement about a standardized variable. $\endgroup$
    – Glen_b
    Commented Jun 12, 2017 at 10:17
1
$\begingroup$

Pointer, I'm a statistical amateur compared to others here, but I think my lack of experience might help me understand what you're having difficulty with.

Negative values are perfectly OK in the test statistic here since your reference distribution can take negative values - as you're using the CLT, your null distribution is the standard normal distribution, which is symmetric around the y-axis (look it up on Wikipedia if you're not sure what I mean). The other possible source of confusion (if you're already quite familiar with the standard normal) is that you might have only needed two-sided tests up to this point. When doing a two-sided test with a symmetric distribution, much of the time people just use the absolute value of the test-statistic and halve the significance level (many people code it in R this way).

Last, here, since you have a one-sided alternative hypothesis, and since the Z-transformed statistic essentially puts your hypothesized mean (10) at 0 (the "minus mu" in the equation), if you think about it, you'll see that your alternative hypothesis would have no chance whatsoever of being true, even before looking up Z(0.05), if your test statistic were positive.

To other, more experienced statisticians here, please correct me if I've given any misinformation (and if I have, many apologies!). I'm trying to learn myself!

$\endgroup$
3
  • $\begingroup$ I think you (and @Glen_b) have suggested a solution to the problem: Since the test statistic has a normal distribution, we can use the properties of the normal distribution. Therefore, In this case, we do not reject the null hypothesis if the test statistic is in the interval $[-1.64, 1.64]$? $\endgroup$ Commented Jun 10, 2017 at 7:12
  • $\begingroup$ not quite; what you just said would be true if you had a two-sided alternative hypothesis (but you'd need to use the .025 and .975 quantiles in that case). But your Ha is one-sided - you don't care if the mean lifespan is more than 10; you just care if it's less than 10. $\endgroup$ Commented Jun 12, 2017 at 1:26
  • $\begingroup$ In case it helps with broader understanding, notice that you have "Xbar-10" in the numerator. B/c your Null assumes that the mean lifespan is 10 hours, you subtract 10 from Xbar to recenter (from 10 to 0) the distribution which your null assumes the data should fit. If your Xbar is less than 10, you'll have a negative Z-statistic. Since your alternative hypothesis is 1-sided, you only care about negative values of Z. As glen_b pointed out, you only care if your battery life is worse than advertised. No one has a problem with battery life that is better than advertised! $\endgroup$ Commented Jun 12, 2017 at 2:12
0
$\begingroup$

Based on your $H_0: \mu = 10$ and $H_1: \mu < 10$, the $H_0$ will be rejected if sample mean is < a specified number. So it should be:

$\Pr(z < z_{0.05}) = 0.05$

$\implies Z_{0.05} = -1.64$

It means if sample z value is < -1.64, then reject $H_0$ at $\alpha = 0.05$ level (one-side test). Your z is -1 > - 1.64, so there is no enough evidence to reject $H_0$ that $\mu = 10$.

$\endgroup$

Your Answer

By clicking “Post Your Answer”, you agree to our terms of service and acknowledge you have read our privacy policy.

Not the answer you're looking for? Browse other questions tagged or ask your own question.