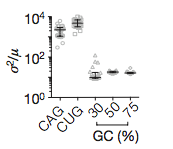
I'm reading a scientific paper where they plot the variance of particle intensity normalized by the mean of particle intensity. I'm a bit confused and don't have an intuition for how this should be helping me. I'm used to seeing standard deviation and variance, both of which reflect dispersion.
What does plot of variance normalized by the mean give me that plot of variance does not?
Here is an example of the graph I am talking about. The x-axis represents the length of an RNA molecule resulting in a distribution of particle sizes. You can just take it as a categorical variable.
edit:
This relation is apparently called the "index of dispersion".
Here they may be looking for "overdispersion" indicate an unexpectedly large grouping or clustering of these particles (which actually what they see under the microscope).
I'm still trying to wrap my head around the intuition though. I know that for a Poisson distribution the mean = variance (dispersion factor = 1), but that's just me knowing facts, and I don't want to go off thinking of this relation as measuring "how Poissonian" a distribution is.

