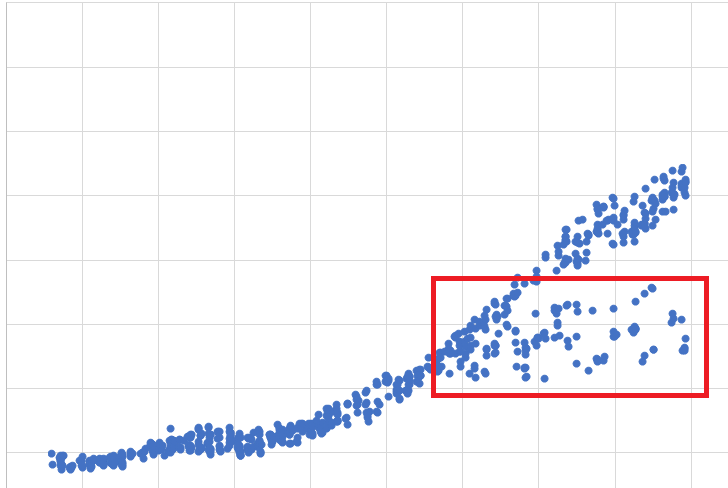
I currently have many sets of data that display more or less the trend in the image, which may be due to abnormalities of the data source. The series "splits" into two different trends, with one growing exponentially and the other scattered and growing much slower. Since only the first trend is desired, those that belong to the latter trend needs to be removed. I'm looking for a method that can be used to remove the data points that isn't growing as per the trend.
The data are series of time-value Pairs. The following plot shows one of the series, with the horizontal axis being the time axis, and the vertical axis being the value recorded at that time.
Sample Data:
    06:35:00    342.0
    06:35:44    332.0
    06:35:47    337.0
    06:40:53    387.0
    06:45:07    383.0
    06:45:10    369.0
    06:46:38    395.0
    06:51:44    384.0
    06:51:45    383.0
    06:52:57    381.0
    06:53:55    384.0
    06:57:38    384.0
I have though out slicing the data into small intervals, cluster them by k-means into two groups then compare the mean. But I'm looking for better methods that may have fewer effects to the first section of the data.

