4
$\begingroup$

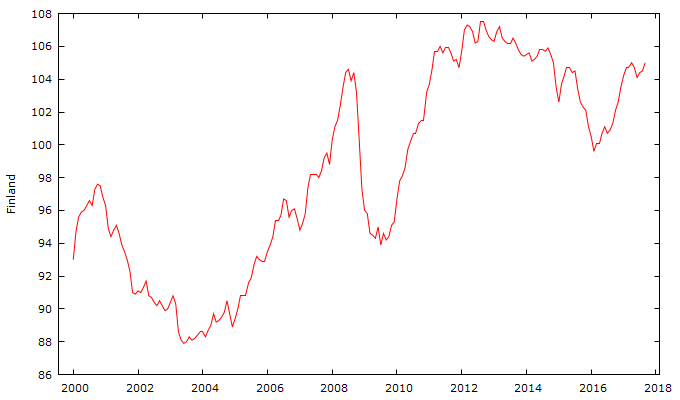
I'm studying methods for time series analysis, using gretl. I have this time series. enter image description hereI used TRAMO and X12-ARIMA to detect probable outlier, but I found nothing. So I used difference-log of first order to make the serie stationary, and I had this: enter image description here It seems that there is something in the end of 2008. Infact TRAMO found a temporary change on November 2008
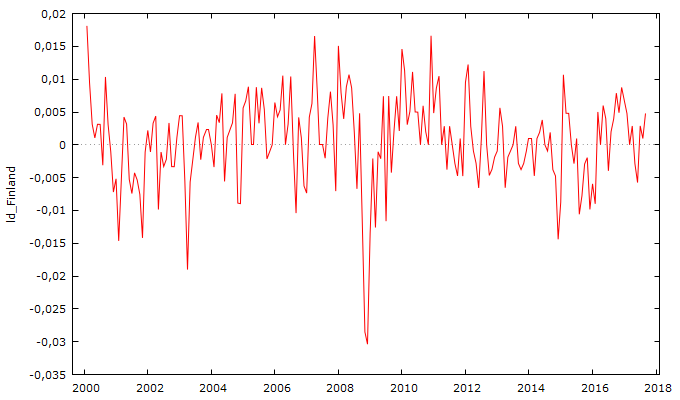
 106 TC    (11 2008)

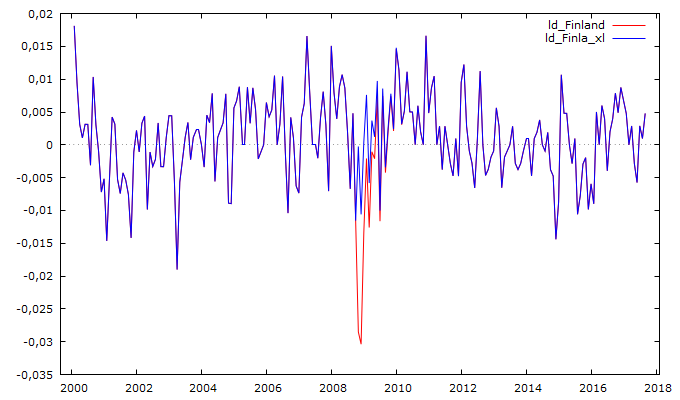
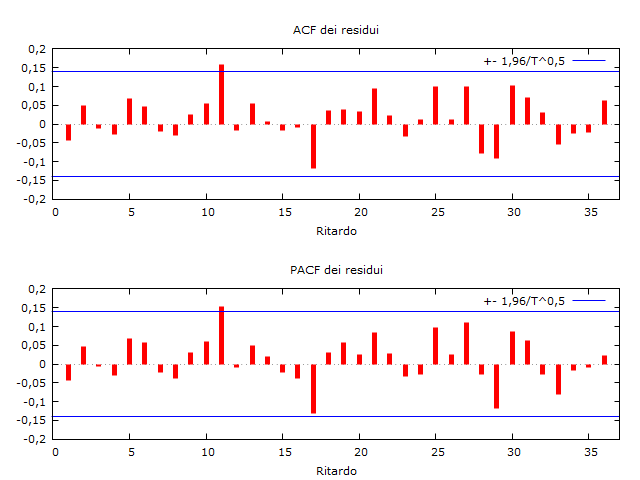
First question: Is it possible that the series before being differentiated had no outlier and after yes? I continued the analysis, linearizing the serie, obtaining enter image description here So I can begin to study the ACF and PACF enter image description here TRAMO suggested me to use ARIMA(1,0,0)(0,1,1), but I found that a simple AR(1) give the same result. These are the ACF-PACF of ARIMA(1,0,0)(0,1,1) residuals: enter image description here and these of AR(1) residuals enter image description here Comparing AIC and BIC, theory suggests to choose the AR(1). This is the output for the ARIMA
    Modello 3: ARIMA, usando le osservazioni 2001:03-2017:09 (T = 199)
    Stimato usando il metodo BHHH (MV condizionale)
    Variabile dipendente: (1-Ls) ld_Finla_xl

                 coefficiente   errore std.      z        p-value 
      ------------------------------------------------------------
      const       7,67509e-05   0,000137004     0,5602   0,5753   
      phi_1       0,307572      0,0671470       4,581    4,64e-06  ***
      Theta_1    −0,765016      0,0511360     −14,96     1,33e-050 ***

    Media var. dipendente  0,000170   SQM var. dipendente    0,008292
    Media innovazioni      0,000046   SQM innovazioni        0,006505
    Log-verosimiglianza    719,6341   Criterio di Akaike    −1431,268
    Criterio di Schwarz   −1418,095   Hannan-Quinn          −1425,937
    Note: SQM = scarto quadratico medio; E.S. = errore standard

                          Reale   Immaginario   Modulo  Frequenza
      -----------------------------------------------------------
      AR
      Radice  1           3,2513     0,0000     3,2513     0,0000
      MA (stagionale)
      Radice  1           1,3072     0,0000     1,3072     0,0000
      -----------------------------------------------------------

this for the AR model

    Modello 1: ARMA, usando le osservazioni 2000:03-2017:09 (T = 211)
    Stimato usando i minimi quadrati (MV condizionale)
    Variabile dipendente: ld_Finla_xl

                 coefficiente   errore std.     z     p-value 
      --------------------------------------------------------
      const      0,000623196    0,000402829   1,547   0,1219  
      phi_1      0,312608       0,0644261     4,852   1,22e-06 ***

    Media var. dipendente  0,000935   SQM var. dipendente    0,006078
    Media innovazioni      0,000000   SQM innovazioni        0,005776
    Log-verosimiglianza    789,1005   Criterio di Akaike    −1574,201
    Criterio di Schwarz   −1567,497   Hannan-Quinn          −1571,491
    Note: SQM = scarto quadratico medio; E.S. = errore standard

                          Reale   Immaginario   Modulo  Frequenza
      -----------------------------------------------------------
      AR
      Radice  1           3,1989     0,0000     3,1989     0,0000
      -----------------------------------------------------------

Second question: TRAMO suggests to use seasonale difference, but from the ACF/PACF it seems that it's not necessary. I know that seasonal difference is requested when there is no stationary caused by the seasonal component. Is it true?

$\endgroup$

1 Answer 1

2
$\begingroup$

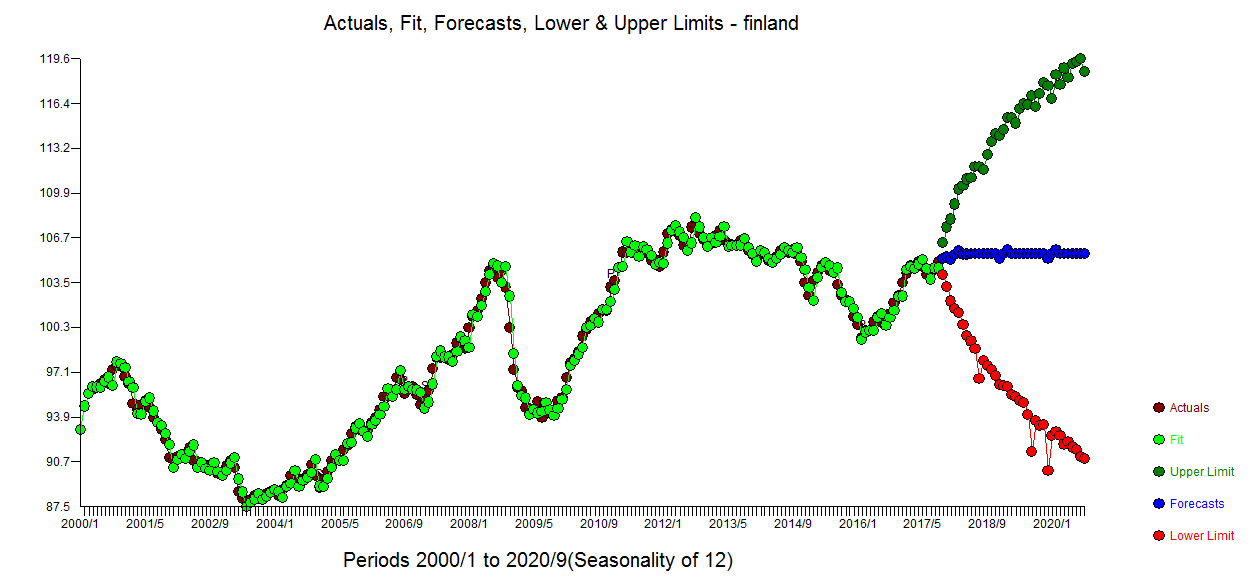
enter image description here

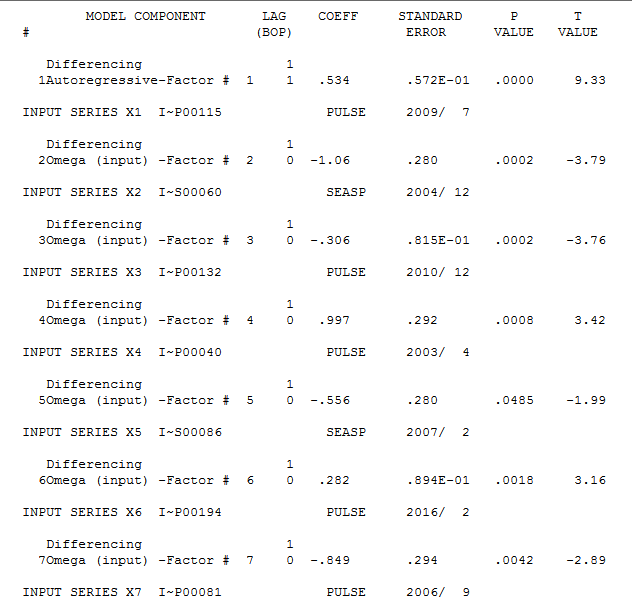
There are three kinds of additive outliers viz, Pulses, Level Shifts and Seasonal Pulses. Tramo Seats does not treat Seasonal Pulses correctly or perhaps not all due to ineffective implementation as it is non-trivial to implement. A Seasonal Pulse is an old-fashioned (but very useful) seasonal dummy which doesn't necessarily start at the beginning of the data. For example if we have 213 historical values but starting at 2004/12 (period 60) there is a consistently higher observation by .306 reflecting Christmas. This would lead to a dummy indicator of the form 59 0's followed by a 1 at the next period and each successive December. Additionally there is detected seasonal dummy required for February starting at period 86 reflecting a trading-day effect as February has fewer business days. The identified equation is hereenter image description here . IMO the fact that only two months have a hint of seasonality in no way suggests seasonal differencing.

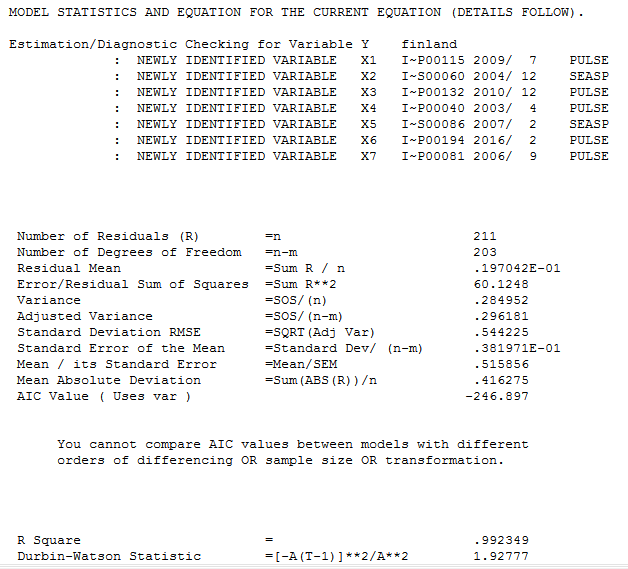
The model statistics are here using AUTOBOX a piece of siftware that I have helped develop enter image description here and here enter image description here

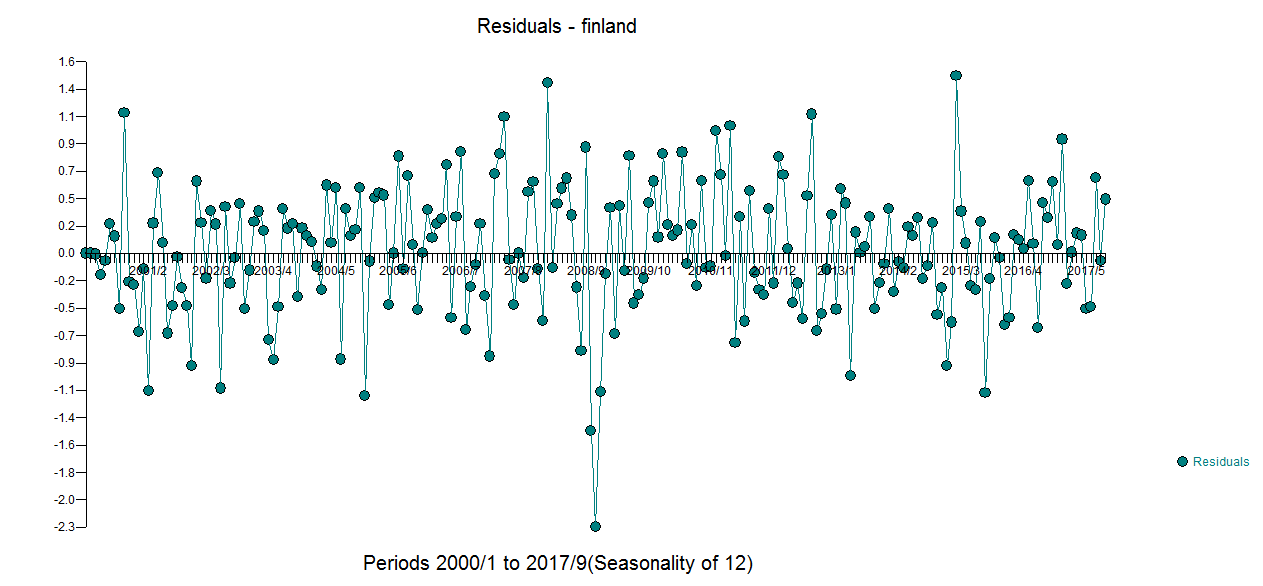
The plot of the residuals is here enter image description here with companion acf enter image description here

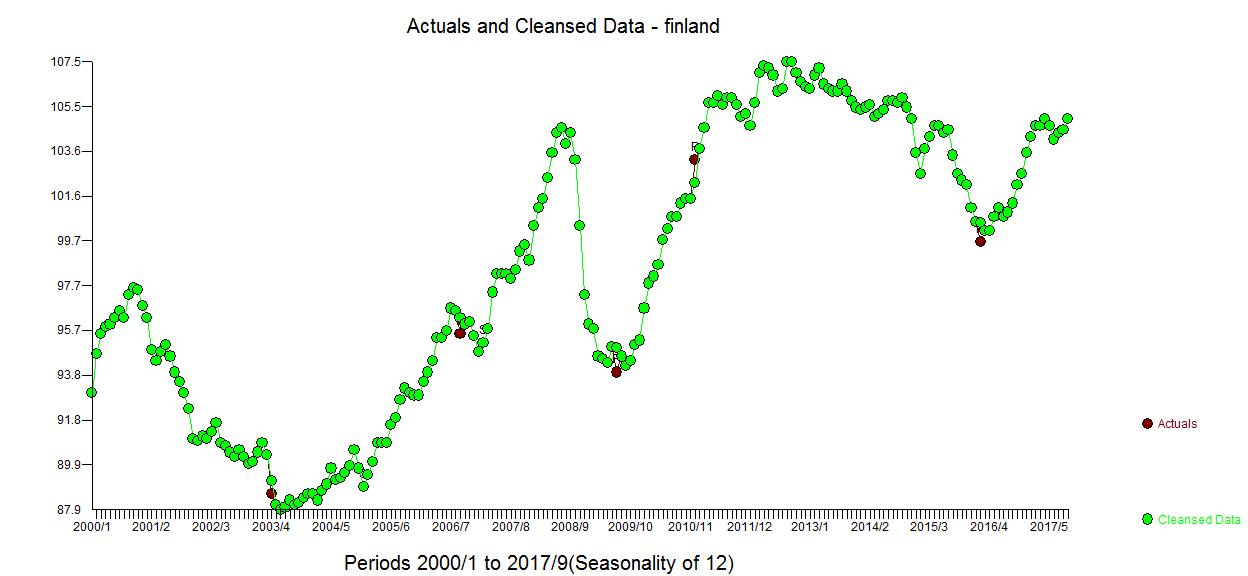
The cleansed vs actual plot is revealing enter image description here and the actual/fit/forecast here enter image description here with possible anomalies in the future.

DIRECT ANSWERS:

1) Is it possible that the series before being differentiated had no outlier and after yes? Yes as the outlier may be hidden due to predictive structure that has yet to be identified much like being unable to "see" if your eyeglasses(filter/model) have a crack in them.

2) TRAMO suggests to use seasonale difference, but from the ACF/PACF it seems that it's not necessary. No there is no need for seasonal differencing just better analytics from Tramo-Seats identifying the need for Seasonal Pulses and their starting point. Unwarranted seasonal differencing INJECTS structure into the residuals (Slutsky effect ? e.g differencing a white noise series creates a new series with greater variance) rather than eliminating structure .

For an extended discussion of the flaws in TS see https://www.researchgate.net/publication/264993978_About_model-based_time_series_procedures_some_remarks_to_TRAMOSEATS_and_CENSUS_X-12-ARIMA

and less so here

https://books.google.com/books?id=HMcJoXf4EJ0C&pg=PA196&lpg=PA196&dq=stier+tramo+seats&source=bl&ots=mHnKXg2CKo&sig=SDJ8S9xYJ9ned4bnEm5Wz7FN67E&hl=en&sa=X&ved=0ahUKEwjw0pLX2NnXAhVDkeAKHcMRDGEQ6AEIQTAE#v=onepage&q=stier%20tramo%20seats&f=false

Finally the presence of a significant acf(11) might be suggestive that the current model is inadequate. There a few possible reasons for this 1) the need to add seasonal arima OR 2) the need to add seasonal dummies OR 3) an unwarranted differencing or power transformation.

In reviewing period 107 and 108 enter image description here , AUTOBOX found their effect to be insignificant given the model at that time. The whole idea is to identify , estimate and validate the need for the coefficients and the sufficiency of the model. TS in its log model without seasonal pulses may have found 107 and 108 to be important.

$\endgroup$
11
  • $\begingroup$ Thanks for the answer IrishStat. I understood what you said, but I don't see the significant ACF(12). Maybe ACF(11)? $\endgroup$
    – zick094
    Commented Nov 25, 2017 at 13:36
  • $\begingroup$ I meant the acf(12) in your analysis. falsely suggesting the need for a seasonal arima structure to be added OR as TS falsely suggested the need for seasonal differencing. Modifications to models need to be as simple as necessary BUT not too simple. TS was just relying on the only remedy they have (perhaps killing the patient !). $\endgroup$
    – IrishStat
    Commented Nov 25, 2017 at 13:53
  • $\begingroup$ I don't think to have understood.. In my analysis the ACF/PACF haven't significative lag 12, both differentiated series and resiual on AR(1) model. But you said " the presence of a significant acf(12) is suggestive that the current model is inadequate", what you meant? The residual of ARIMA one or of AR one? Thanks again. $\endgroup$
    – zick094
    Commented Nov 25, 2017 at 14:07
  • $\begingroup$ Perhaps your/TS (unwarranted) need to take logs caused the big difference in detecting the first major anomaly . Logs like any other forms of transformations (differencing,arima,detrending et al) can have negative consequences. See here for when and why to take power transforms stats.stackexchange.com/questions/18844/…. Notice that my plot of residuals in no way suggests a linkage between the expected value and the local variance. $\endgroup$
    – IrishStat
    Commented Nov 25, 2017 at 14:08
  • 1
    $\begingroup$ Don't worry IrishStat, that's enough. Thank you for helping! $\endgroup$
    – zick094
    Commented Nov 26, 2017 at 17:05

Your Answer

By clicking “Post Your Answer”, you agree to our terms of service and acknowledge you have read our privacy policy.

Not the answer you're looking for? Browse other questions tagged or ask your own question.