I have a data file with task duration values for three groups, and I want to determine group effect on task duration (tasks were executed by individuals; each group had 7 different individuals; each individual executed the same three tasks; and the data for one individual in group B was not recorded because of a setup problem during the experiment).
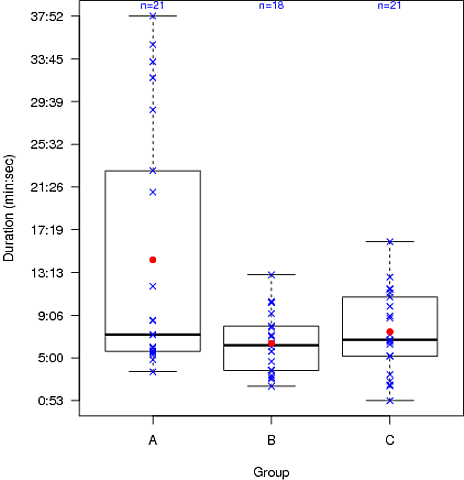
I have created from the data file the following box plot (red dots are the means, and "n" is the number of time values in each group):

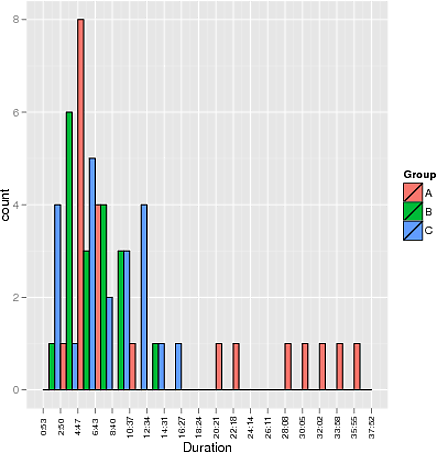
and also the following histogram (duration given in "min:sec"):

My data sample per group is small, and "Shapiro-Wilk normality test" tells me that group A does not come from a normal distribution, and that groups B and C come from a normal distribution. Because groups are small and one group is non-normal, I decided to run Kruskal-Wallis one-way analysis of variance (non-parametric) and its result was:
Kruskal-Wallis rank sum test
data:  Duration by Group
Kruskal-Wallis chi-squared = 4.2811, df = 2, p-value = 0.1176
so I should accept that the effect of the groups was not significant (p-value > 0.05).
However, when I run one-way Anova (sanity check just in case Kruskal-Wallis was not the correct choice), Anova's result was:
ANOVA Duration ~ Group
            Df    Sum Sq   Mean Sq F value  Pr(>F)
Group        2 0.0003692 1.846e-04   6.473 0.00293 **
Residuals   57 0.0016257 2.852e-05
---
Signif. codes:  0 ‘***’ 0.001 ‘**’ 0.01 ‘*’ 0.05 ‘.’ 0.1 ‘ ’ 1

Tukey multiple comparisons of means
   95% family-wise confidence level

             diff          lwr           upr     p adj
B-A -0.0055763154 -0.009704328 -0.0014483027 0.0054132
C-A -0.0048032407 -0.008769307 -0.0008371744 0.0138750
C-B  0.0007730747 -0.003354938  0.0049010874 0.8943085
That is, Anova returns p-value < 0.05, that is, it is telling that the group effect is significant (in this case, group A was significantly different regarding B and C).
However, because of a small number of samples per group and the fact that one group is not normally distributed, I tend to accept Kruskal-Wallis result, but I am not sure.
So my questions are:
Should I accept Kruskal-Wallis result because this test is more adequate than Anova for this particular case?
How should I have used the box plot and the histogram to decide for the most adequate test?
Thanks
