1
$\begingroup$

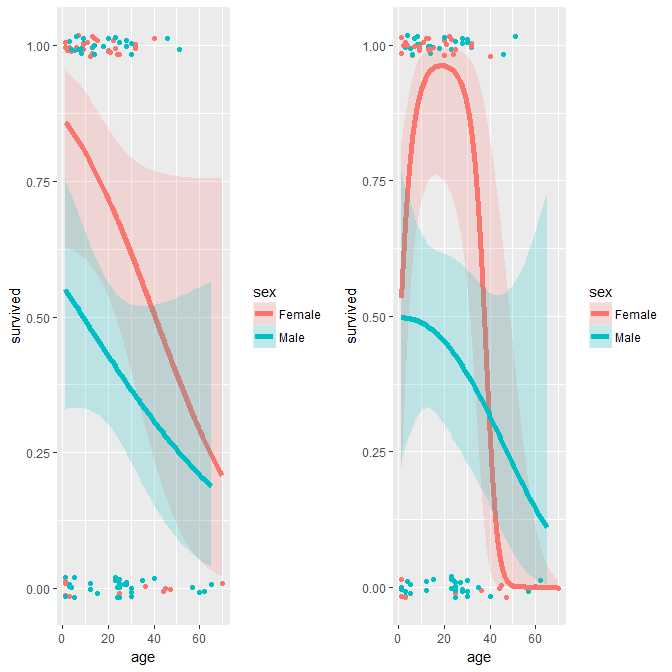
Here are two examples of binomial model fitting. In the second example, the independent variable is modeled using poly() as a second order polynomial.

How do I interpret these 2 results? Why someone would want to use the poly(2)? This would be overfitting in the context of logistic regression, right?

I understand that for the linear models, like lm(y ~ x + I(x^2)), the second order is used to check whether the more complex model provides better fits to our data, vis-a-vis minimizing the residuals, but logistic regression has no residuals (error terms).

The poly(,2) depicts completely different picture about survival of M/F across age.

library(vcdExtra)
library(ggplot2)
require(gridExtra)

data(Donner, package="vcdExtra")

head(Donner)

# separate linear fits on age for M/F
g1 <- ggplot(Donner, aes(age, survived, color = sex)) + geom_point(position = position_jitter(height = 0.02, width = 0)) +
   stat_smooth(method = "glm", method.args = list(family = binomial),  formula = y ~ x,  alpha = 0.2, size=2, aes(fill = sex))

# separate quadratics
g2 <- ggplot(Donner, aes(age, survived, color = sex)) + geom_point(position = position_jitter(height = 0.02, width = 0)) +
   stat_smooth(method = "glm", method.args = list(family = binomial),  formula = y ~ poly(x,2), alpha = 0.2, size=2, aes(fill = sex))

grid.arrange(g1, g2, ncol=2)

enter image description here

$\endgroup$

1 Answer 1

2
$\begingroup$

A linear term in a logistic regression model models an S-shaped curve depicting the probability of the event at increasing or decreasing levels of the exposure if the slope term is positive or negative respectively. However, there are cases when the S-shaped curves do not accurately model the association. Hazards for events may increase with age which would form an asymmetric-S. The event may also have a bathtub shaped hazard, such as the risk of testicular cancer in men which peaks around age 25. In that case, the risk curve we would like to fit is one where the risk is low at very young and very old ages, but can peak at a certain age. The quadratic term in a logistic model can achieve this.

Adding a quadratic term to a logistic regression model will only cause overfitting if the number of observations is very small. You are right that we do not have an analogue of mean-squared error by which to evaluate and compare the adequacy of the model fit with logistic regression models. Nested logistic models can be tested for statistical significance using likelihood ratio tests, however, which directly corresponds to the fitted and observed binomial probability of the outcome, so this seems like a more general analogue of the MSE for non-Gaussian responses.

The interpretation of the exponentiated coefficient for the linear term in the logistic model is the odds ratio for the outcome comparing groups differing by 1-unit in the exposure. When adding a quadratic term, this interpretation changes: it is the odds ratio for the outcome comparing groups differing by 1-unit in the exposure when the exposure level is 0. The quadratic term is interpreted as the ratio of odds ratios comparing groups differing by 1-unit in the exposure. So for instance, if the quadratic term has a coefficient of 2, I would predict that the ratio of odds for the outcome comparing X=2 to X=1 is twice the that of the ratio of X=1 to X=0.

$\endgroup$

Your Answer

By clicking “Post Your Answer”, you agree to our terms of service and acknowledge you have read our privacy policy.

Not the answer you're looking for? Browse other questions tagged or ask your own question.