1
$\begingroup$

There are lots of related CV questions to the title above, but I'm looking for some clarification on a specific approach, and some explanation.

The set up is as follows (adapted from another question) https://stats.stackexchange.com/a/93548/87437:

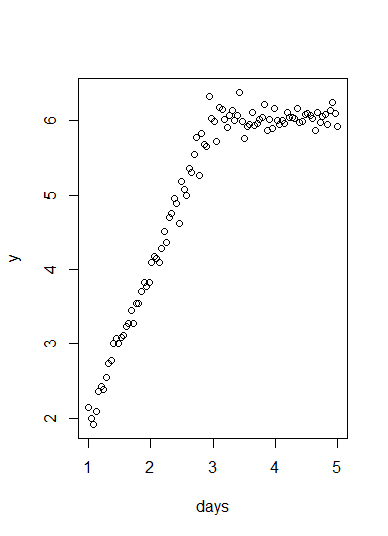
days=seq(1,5,length=100)
y=numeric(100)
y[1:50]=2*days[1:50]
y[51:100]=rep(2*days[51],50)
z=rnorm(100,0,.15)
y=y+z
plot(days,y)

enter image description here

Some data points are plotted (note that here time is the independent variable) and we can see that a change point (by the set up) occurs at days = 3.

Comparing slopes generally is referred to in a number of questions (1, 2, 3) but most closely to this one.

In general, the three main approaches are as follows:

  1. Add a dummy variable for the intervention, and look at the significance of the interaction coefficient between the independent variable and the dummy variable
  2. Run a Chow test
  3. Calculate two separate regression lines, and then run a test to see if they differ (like here).

I have also seen but not used packages like https://google.github.io/CausalImpact/, which seems to take a Bayesian approach.

Finally, it could be that none of these are appropriate, as suggested here.

What is the difference in these methods, assuming they are applicable (especially when related to my use case with a time series and an intervention), and how should I choose between them? I'm specifically interested in the underlying assumptions of each, the statistical power, and anything else relevant.

As a sub question, it feels like method 3 is a bit naïve, perhaps because it's treating the pre- and post- interventions as independent groups (I think) - I also can't find many references to it in literature (as opposed to the dummy variable approach, which comes under the umbrella of Interrupted Time Series), so I'm interested to hear anything about the pros and cons of this approach in comparison to the dummy variable approach.

$\endgroup$

1 Answer 1

1
$\begingroup$
  1. This is a more conservative version of Chow's test: reject the null only if the interaction term(s) is/are significant.
  2. Chow's test is a global test of the pre/post indicator as well as its interactions with trend covariates. For instance, if time is modeled linearly, the null model has two parameters: intercept and trend, but with the pre/post breakpoint there are four parameters: intercept at time 0, trend in pre/period, intercept change, and trend difference in post period. The 2 degree of freedom Chow test assesses these nested models.
  3. The suggested test is the same as 1 with important caveats: it is more robust in that it permits different residual error in pre/post period. However, it is limited in that it does not explicitly inspect the covariance between the covariates. They should be independent, but the error structure can indicate unmeasured correlations in the data.
$\endgroup$
4
  • $\begingroup$ '3. The suggested test is the same as 1' : Does this mean that in each approach, the same model will be fitted? 'it does not explicitly inspect the covariance between the covariates': How does 1 do this differently? To check the covariance between the covariates, you suggest looking at the error structure - can you give me some more detail on what this means? $\endgroup$
    – TMrtSmith
    Commented Jan 25, 2018 at 9:27
  • 1
    $\begingroup$ @TMrtSmith no, in case 1, 1 model is fit with the pooled sample, all residuals are used to calculate the residual standard error. In case 2, 2 models are fit for the pre and post periods separately, there are two estimates of residual standard error. For two tests to be the same, I mean that if you had an $n$ of $\infty$ they would agree in every case as to whether the null hypothesis is true or false. The inference may differ in finite samples, however. $\endgroup$
    – AdamO
    Commented Jan 25, 2018 at 15:08
  • $\begingroup$ Ok, so in my situation, I have less data points in the post-intervention than the pre-intervention. Extending your answer, I want to say that the 2-model approach is less appropriate here since the residual standard error is higher in the post-intervention. Is there any way to compare the joint standard error of the two models against the 1-model approach, or can I compare them separately? How do I decide which approach to take - since I don't have an infinite number of data points, and my tests don't agree! $\endgroup$
    – TMrtSmith
    Commented Jan 25, 2018 at 16:25
  • 1
    $\begingroup$ @TMrtSmith I think you have it backwards: the 2 model approach would be better if there is heteroscedasticity as you describe it since there would be homoscedastic models. Of course, you could use robust standard "sandwich" errors and use either model to get accurate SE estimates. I would not compare the results of the two model-approach to the one model approach. You know they should be approximately the same. Comparing differences doesn't tell you anything interesting. If both are borderline statistically significant, it reminds you 0.05 is arbitrary. $\endgroup$
    – AdamO
    Commented Jan 25, 2018 at 16:37

Your Answer

By clicking “Post Your Answer”, you agree to our terms of service and acknowledge you have read our privacy policy.

Not the answer you're looking for? Browse other questions tagged or ask your own question.