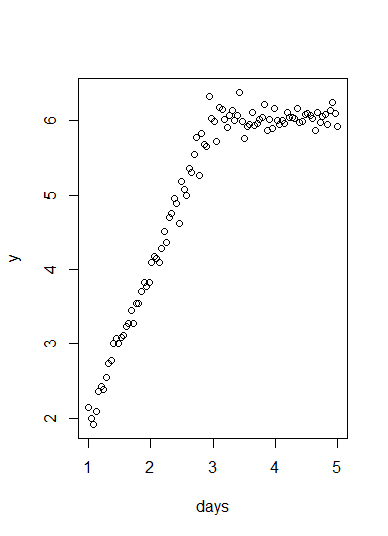
There are lots of related CV questions to the title above, but I'm looking for some clarification on a specific approach, and some explanation.
The set up is as follows (adapted from another question) https://stats.stackexchange.com/a/93548/87437:
days=seq(1,5,length=100)
y=numeric(100)
y[1:50]=2*days[1:50]
y[51:100]=rep(2*days[51],50)
z=rnorm(100,0,.15)
y=y+z
plot(days,y)
Some data points are plotted (note that here time is the independent variable) and we can see that a change point (by the set up) occurs at days = 3.
Comparing slopes generally is referred to in a number of questions (1, 2, 3) but most closely to this one.
In general, the three main approaches are as follows:
- Add a dummy variable for the intervention, and look at the significance of the interaction coefficient between the independent variable and the dummy variable
- Run a Chow test
- Calculate two separate regression lines, and then run a test to see if they differ (like here).
I have also seen but not used packages like https://google.github.io/CausalImpact/, which seems to take a Bayesian approach.
Finally, it could be that none of these are appropriate, as suggested here.
What is the difference in these methods, assuming they are applicable (especially when related to my use case with a time series and an intervention), and how should I choose between them? I'm specifically interested in the underlying assumptions of each, the statistical power, and anything else relevant.
As a sub question, it feels like method 3 is a bit naïve, perhaps because it's treating the pre- and post- interventions as independent groups (I think) - I also can't find many references to it in literature (as opposed to the dummy variable approach, which comes under the umbrella of Interrupted Time Series), so I'm interested to hear anything about the pros and cons of this approach in comparison to the dummy variable approach.

