I took two separate water samples (one sample per bottle) in twenty one river locations (n=42). For the purpose of this question I am calling the two bottles duplicates.
I am trying to show how environmental DNA (eDNA) attenuates with river distance from a cage of organisms. So the samples were taken every 0.4 km up to 13 km from the caged organisms. However, in many locations one sample tested positive for eDNA and the other was a non-detect.
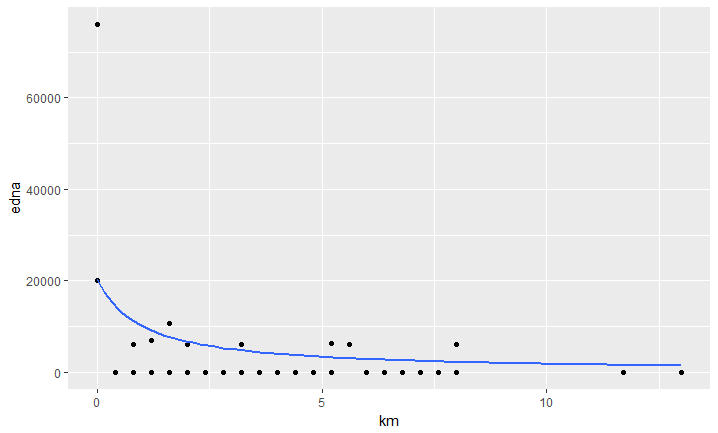
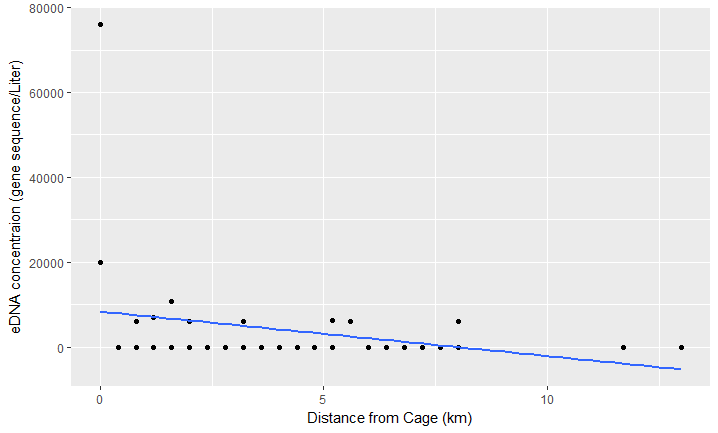
For the purpose of plotting the data I assigned the non-detects a 0. Is this correct? I tried running a linear regression and non-linear regression (See plots below).
I don't think this is a good option since only 11 of my samples tested positive for eDNA and I do not know if it was correct to assign a 0 to the non-detects. However, I am providing the plots so you can see what my data looks like. Please note there are two samples for every km interval (if there looks like there is only one it is because the values are the same).
Someone also suggested a Gaussian GLM, but I am not sure if that is correct either? And if so, how do I deal with the non-detects?
I am looking for some type of statistical analysis to show how eDNA attenuates with distance. Any suggestions with my data set? Would running a Monte Carlo analysis here be a good option?


