8
$\begingroup$

This is a follow-up question I have after reviewing this post: Difference in means statistical test for non-normal, heteroscedastic data?

To be clear, I am asking from a pragmatic perspective (not to suggest that theoretical responses are not welcome). When normality among groups is present (different from the title of the question referenced above), but the group variances are substantively different, what is the worst that a researcher might observe?

In my experience, the issue that arises the most with this scenario is "strange" patterns in the post hoc comparisons. (This has been observed both in my published work, but also in pedagogic settings...happy to provide details of this in the comments below.) What I have observed is something akin to this: You have three groups with $M_1 < M_2 < M_3$. The (omnibus) ANOVA gives $p<\alpha$, and the pairwise $t$-tests suggest $M_2$ is statistically significantly different from the other two groups...but $M_1$ and $M_3$ are not statistically significantly different. Part of my question is if this is what others have observed, but also, what other issues have you observed with comparable scenarios?

A quick review of my reference texts suggest ANOVA is rather robust to mild to moderate violations of the homoscedasticity assumption, and even more so with large sample sizes. However, these references do not specifically state (1) what could go wrong or (2) what might happen with a large number of groups.

$\endgroup$
3
  • 1
    $\begingroup$ not sure why the link to the original question isn't showing up (just showing as plain text)...also, in the other question, the title says "non-normal", but the discussion is about normal data $\endgroup$
    – Gregg H
    Commented Mar 24, 2018 at 19:14
  • $\begingroup$ It's because you've included HTML in your question. Just use the formatting options presented in the formatting toolbar -- it will format everything correctly. $\endgroup$
    – Sycorax
    Commented Mar 24, 2018 at 19:41
  • 2
    $\begingroup$ You get asupernova $\endgroup$
    – user541686
    Commented Mar 25, 2018 at 5:45

3 Answers 3

5
$\begingroup$

Group comparisons of means based on the general linear model are often said to be generally robust to violations of the homogeneity of variance assumption. There are, however, certain conditions under which this is definitely not the case, and a relatively simple one is a situation where the homogeneity of variance assumption is violated and you have disparities in group sizes. This combination can increase your Type I or Type II error rate, depending on the distribution of disparities in variances and sample sizes across groups.

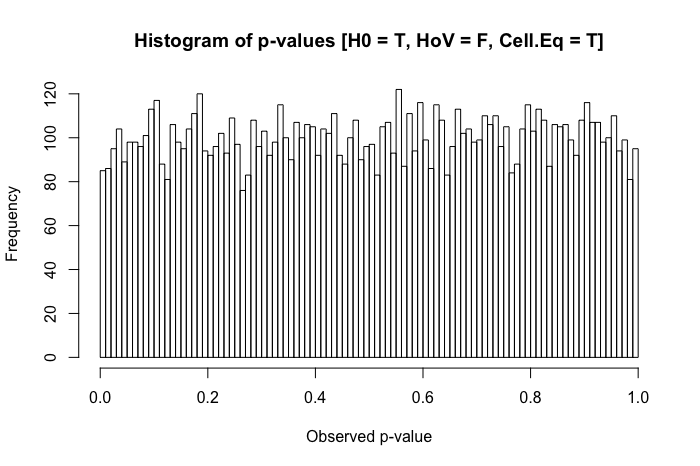
A series of simple simulations of $p$-values will show you how. First, let's look at how a distribution $p$-values should look like when the null is true, the homogeneity of variance assumption is met, and group sizes are equal. We will simulate equal standardized scores for 200 observations in two groups (x and y), run a parametric $t$-test, and save the resulting $p$-value (and repeat this 10,000 times). We will then plot a histogram of the simulated $p$-values:

nSims <- 10000
h0 <-numeric(nSims)

for(i in 1:nSims){ 
x<-rnorm(n = 200, mean = 0, sd = 1) 
y<-rnorm(n = 200, mean = 0, sd = 1)  
z<-t.test(x,y, var.equal = T) 
h0[i]<-z$p.value 
}

hist(h0, main="Histogram of p-values [H0 = T, HoV = T, Cell.Eq = T]", xlab=("Observed p-value"), breaks=100)

enter image description here

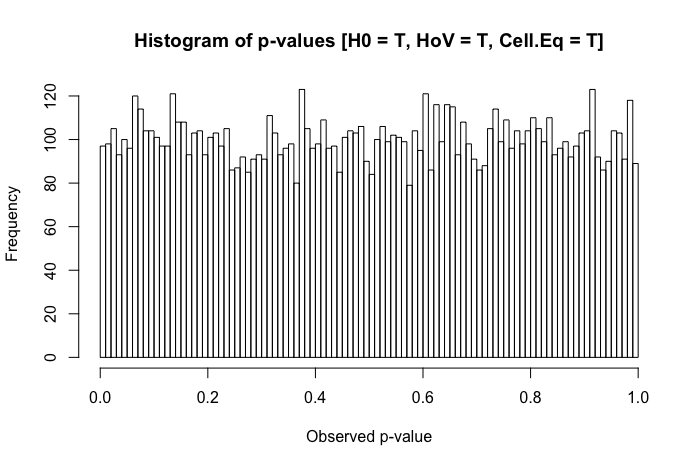
The distribution of $p$-values is relatively uniform, as it should be. But what if we make group y's standard deviation 5 times as large as group x's (i.e., homogeneity of variance is violated)?

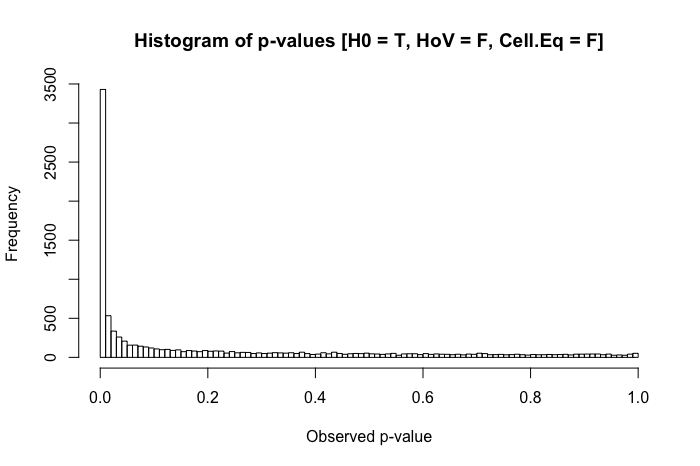
enter image description here

Still pretty uniform. But when we combine violated homogeneity of variance assumption with disparities in group size (now decreasing group x's sample size to 20), we run into major problems. enter image description here

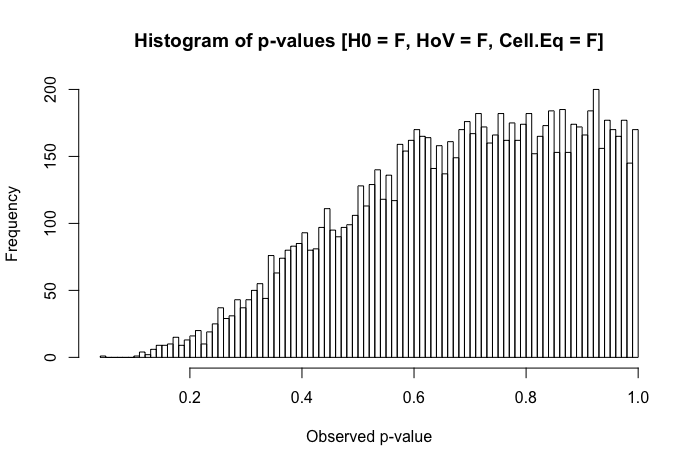
The combination of a larger standard deviation in one group and a smaller group size in the other produces a rather dramatic inflation in our Type I error rate. But disparities in both can work the other way too. If, instead, we specify a population where the null is false (group x's mean is .4 instead of 0), and one group (in this case, group y) has both a larger standard deviation and the larger sample size, then we can actually hurt our power to detect a real effect:

enter image description here

So in summary, homogeneity of variance isn't a huge problem when group sizes are relatively equal, but when group sizes are unequal (as they might be in many areas of quasi-experimental research), homogeneity of variance can really inflate your Type I or II error rates.

$\endgroup$
4
$\begingroup$

Gregg, do you mean for normal, heteroscedastic data? Your second paragraph seems to suggest so.

I added an answer to the original post you reference, where I suggested that if the data are normal but heteroscedastic, using generalized least squares provides the most flexible approach for dealing with the data features you mention. Not accounting explicitly for those features will lead to suboptimal and possibly misleading results, as you noticed in your own practice. How suboptimal or misleading the results may be will ultimately depend on the peculiarities of each data set.

A nice way to understand this would be to set up a simulation study where you can vary two factors: the number of groups and the extent to which the variability changes across groups. Then you could track the impact of these factors on the results of the test of differences between any of the means and the results of post-hoc comparisons between pairs of means when you use standard ANOVA (which ignores heteroscedasticity) versus gls (which accounts for heteroscedasticity).

Perhaps you could start your simulation exercise with a simple example with just 3 groups, where you keep the variability of the first two groups the same but change the variability of the third group by a factor f where f becomes increasingly large. This would allow you to see if and when that third group begins to dominate the results. (For simplicity, the differences in mean outcome values between each of the three groups could be kept the same, though you could look to see how the magnitude of the common difference plays with the magnitude of the variability in the third group.)

I think it would be hard to come up with a general assessment of what exactly might go wrong when heteroscedasticity is ignored, other than warning people that ignoring heteroscedasticity is ill-advised when better methods for dealing with it exist.

$\endgroup$
2
  • $\begingroup$ yes, the scenario here is meant to reference just violations of the homoscedastic assumption $\endgroup$
    – Gregg H
    Commented Mar 24, 2018 at 19:17
  • $\begingroup$ Yes, that original post was a bit confusing, as it mentioned non-normality of the data in its title but normality in the actual question. Thanks for the clarification! $\endgroup$ Commented Mar 24, 2018 at 19:23
3
$\begingroup$

Well, for non-normal heteroskedastic data, in the worst case, you could have no meaning at all. Consider variables drawn from $$\frac{1}{2\pi}\frac{\sigma}{\left[\left(r_1-\mu_1\right)^2+(r_2-\mu_2)^2+\sigma^2\right]^{\frac{3}{2}}},$$ which you would get if you were drawing returns from two equity securities, then ANOVA would produce an entirely random result uncorrelated with reality. It would have a power of zero regardless of sample size.

$\endgroup$
1
  • $\begingroup$ thanks for this, though the specific scenario I'm interested in here is for normal but heteroscedastic (sorry about the confusion from the link to the earlier question) $\endgroup$
    – Gregg H
    Commented Mar 24, 2018 at 19:12

Your Answer

By clicking “Post Your Answer”, you agree to our terms of service and acknowledge you have read our privacy policy.

Not the answer you're looking for? Browse other questions tagged or ask your own question.