I have a question regarding one way ANOVA in order to see whether there is a significant difference using SPSS; I have 3 groups of unequal sample sizes (n=7, n=7 and n= 13). I know that the sample sizes are small, and I can't therefore find the suitable post-hoc test for this analysis of data. I tried the Tukey test, but it was not working...?
-
$\begingroup$ Welcome to the site. For others to be able to assist you, you will need to provide much more detail. For example, you mention three variables, and 3 groups. Please describe. $\endgroup$– Gregg HCommented Apr 12, 2018 at 13:37
-
$\begingroup$ Sorry I was not clear, I do not know much about stats! I meant that I have 3 different groups with unequal sample sizes. I will try to add a screenshot. $\endgroup$– StanislasCommented Apr 12, 2018 at 13:57
-
$\begingroup$ Copying and pasting the 27 values into your question would let people experiment. It's harder to copy from an image except the tedious way. In any case what does "not working" mean? SPSS refused? The results made no sense to you? etc.? etc.? $\endgroup$– Nick CoxCommented Apr 12, 2018 at 14:09
-
1$\begingroup$ Sorry for that, I just edited the post with the values included. By not working I mean that I would get these warnings ''Post hoc tests are not performed for B because at least one group has fewer than two cases. Post hoc tests are not performed for C because at least one group has fewer than two cases.'' I used a Tukey test but it is obviously not the one to use, or I have done it incorrectly.. I'm mostly interested by the sigma values. $\endgroup$– StanislasCommented Apr 12, 2018 at 14:13
-
1$\begingroup$ I have not used SPSS in the current millennium but I can't see that any group has fewer than 2 cases! $\endgroup$– Nick CoxCommented Apr 12, 2018 at 15:04
2 Answers
The problem you are describing stems from having entered your data in parallel format (each group is recorded in its own column) vs. in serial format (each group is recorded in the same column, but there is a second column indicating the group membership).
Using your data, it should appear in SPSS in two columns like this:
1   18.67
1   39.88
1   19.33
1   3.17
1   5.77
1   13
1   10.18
2   10.86
2   9.5
2   5
2   13
2   3.9
2   7.94
2   7.38
2   16.82
2   11.67
2   13.31
2   9
2   12.79
2   14.1
3   14.6
3   22.9
3   16.38
3   6.77
3   2.75
3   13
3   25.5
With data in this format, you will be able to run the ANOVA and select the post hoc follow-up options (and they will run).
Hope this helps.
-
$\begingroup$ Thank you so much! Completely forgot about this, it worked! $\endgroup$ Commented Apr 12, 2018 at 15:26
There are always plenty of votes for post hoc, so here is one for ante hoc, looking at the data in exploratory manner to see what they show and how that might guide the analysis. (The same Tukey really is the name to invoke too.)
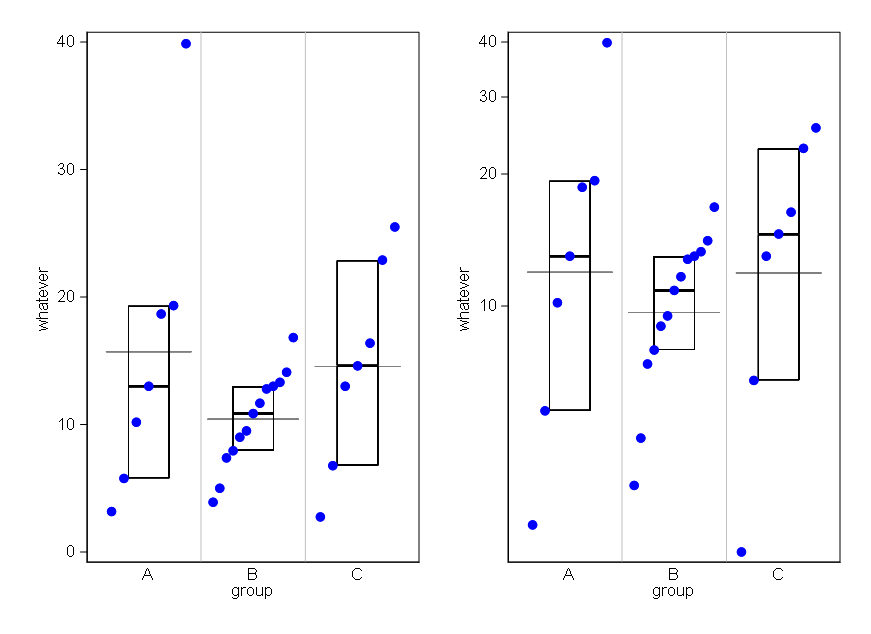
I suggest that with plain ANOVA most conclusions will hinge on the outlier at 39.88, which pulls up the mean for A mightily.
On the face of it, working on logarithmic scale would not just pull in that outlier but might make more sense.
The display on the left is just a couple of twists away from a fairly conventional box plot, the twists being
- Display of all points as a superimposed quantile plot. (A more prosaic vertically-aligned dot plot would work almost as well, but not quite.) In Parzen's terms, that is a quantile-box plot, although (side issue) that term appears with other meanings in statistical literature. If you want to follow that path, see any or all of
How to visualize independent two sample t-test?
How do I get which experiment is doing better using the Mann-Whitney U Test?
How can I measure difference between non-parametric data with many zeros?
- Horizontal reference lines show the means.
The display on the right is the same idea, except plots are on logarithmic scale and the reference lines are geometric means.
Pessimists may want to shout ad hoc, but that just stands for (even if the translation is new to you) "fit for purpose". I note that the ordering A C B is the same for means and geometric means, but not for medians.
If I were advising for real, I would first ask what is being measured as a response variable and try to work out whether logarithmic scale made scientific or practical sense for that response.
-
$\begingroup$ Oh wow, thank you very much for all your help! I will have a look at all that now. $\endgroup$ Commented Apr 12, 2018 at 20:48

