4
$\begingroup$

I've got an extremely limited understanding of statistics, and every explanation I've found uses further technical terms that I don't understand. I'm trying to figure out:

  1. What exactly is posterior probability
  2. What exactly is a p-value (my understanding of this is that if your p-value is beneath your cut off then it suggests that your observation was not by chance, and the smaller your p-value is, the less it might be the case that it was chance. But I don't actually know what a p-value is)
  3. Are they interchangeable? What would be the difference between using one or the other? Are they suited to different things specifically?

Apologies for asking such a basic question, I'm really confused and no amount of basic explanations are actually basic enough.

$\endgroup$

2 Answers 2

10
$\begingroup$

1) A posterior probability distribution is simply the probability distribution of your parameter after having seen the data. In the general framework of Bayesian statistics, you put a prior distribution on your parameter that reflects your belief about what it might be. You also have a likelihood function for your data that says if we know what the parameter is, then this is how the data will be distributed. Given these pieces of information along with the data we observe, we can determine the posterior probability distribution. The idea is that we have an initial belief about the parameter, then we observe some data that tells us something about the parameter, and then we update our belief based on the data. The result of this update is the posterior probability distribution. The posterior probability distribution tells us the degree of belief we should have for any particular value of the parameter.

2) A p-value is a frequentist construction. A p-value tells us "What is the probability we observed this data if the null hypothesis is true?". This is why a low p-value implies it is less likely the null hypothesis is true.

3) No, they're not interchangeable. The fundamental difference between a p-value and a posterior probability is that a p-value is a statement about the probability of observing data, while a posterior probability is a statement about the degree of belief of a particular parameter.

The difference in using one or the other is often a subjective choice. Some people like the frequentist philosophy better than the Bayesian philosophy and vice versa. One reason for using the Bayesian method is that you have the ability to specify a prior, which might be useful if you have domain information you wish to incorporate into your analysis. Bayesian methods can also be more effective in the case of small sample size, since they do not rely on asymptotics or large sample properties.

$\endgroup$
13
  • $\begingroup$ Thanks so much for this, it has brought the explanation about 75% of the way down to my level. May I ask what a few terms you've used mean in this context: 'Parameter', 'Likelihood function', 'Degree of belief' (is this just the value telling us 'how sure'?) and 'a prior' .I'm sorry, I am not a math person :( $\endgroup$
    – Sophie
    Commented Apr 19, 2018 at 18:35
  • $\begingroup$ And am I correct in thinking based on your last statement that a p-value requires normal distribution and prosterior probability doesn't? $\endgroup$
    – Sophie
    Commented Apr 19, 2018 at 18:46
  • $\begingroup$ Parameter: Typically the thing you're trying to estimate. A distribution will have certain "parameters" that determine their center point, shape, spread, etc. For example, the two parameters of the normal distribution are mean and variance. Likelihood function: A likelihood function basically says "If we know the parameter is some particular value, what is the likelihood we observe the given data?" Yes, you can interpret degree of belief in that way. A prior distribution is the distribution of our degree of belief in values of a parameter before we observe any data. $\endgroup$ Commented Apr 19, 2018 at 19:07
  • $\begingroup$ Neither necessarily require the normal distribution. $\endgroup$ Commented Apr 19, 2018 at 19:08
  • $\begingroup$ A quick example: Say we estimating the average height of a particular type of tree. Before we take any measurements, we have an initial belief of what the average height of this type of tree might be. Say we think the average height is around 150 inches, but we aren't very certain. So our prior distribution on the average height might be a normal distribution with mean 150 and variance 40. Then we take a bunch of height measurements of these trees. Say the sample average of these comes out to 175. Using these two pieces of information, we can then come up with... (continued on next comment) $\endgroup$ Commented Apr 19, 2018 at 19:12
6
$\begingroup$

Maybe it would be easiest to see the differences in an example where the Bayesian answer doesn't at all look like the Frequentist answer.

Imagine a world where the American Society of Magicians convinces Congress to create magical quarters. They are either 1/3rd biased for heads, 2/3rds biased for heads or a fair coin. You want to test what kind of coin you have from a randomly selected coin from a bank.

For some reason, you decide that you are going to flip the coin exactly eight times and try to infer the true value from the coin toss. You are going to use both a Bayesian and a Frequentist method to perform the test.

For the Frequentist test, you have three possible hypotheses in the set $\{\pi=1/3,\pi=1/2,\pi=2/3\}$. You can only choose one, so you choose $\pi=1/3$. If you had chosen a different null hypothesis, then you would get a different test solution.

Each test is a Bernoulli trial and the long run distribution will be the binomial distribution. Since your null hypothesis is $\pi=1/3$ your test distribution will be in the following table.
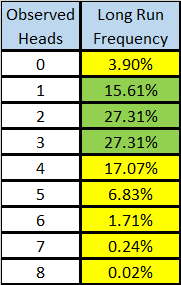
Frequentist Test

Because there are only going to be 8 tosses and there is low power, we are only going to use a 70% degree of confidence. The green area is the confidence region one would expect to see if $\pi=1/3$ and the yellow is the rejection region. If you would repeat the test of eight tosses an infinite number of times and if the null is true then you should expect to see this distribution of toss frequencies.

Notice though that if the number of successes is zero, then not only would this reject the null of $\pi=1/3$ it would reject the others as well. It is possible for a Frequentist solution to generate a rejection of all possible answers in an extreme case.

The p-value is the probability you would expect to see if the null is true. If the null is not true, then we know nothing about the probabilities. You are asserting it is true with the goal of falsifying it.

For the Bayesian problem, you do not choose a hypothesis. You do choose a prior. At first, you consider all three hypotheses as equally likely so you assign equal weight to each. You realize this is a poor choice as there is probably data on how many of each are minted. You go to the Mint's website and find out that the true probability for a randomly selected coin is 25% that $\pi=1/3$, 50% that $\pi=1/2$ and 25% otherwise.

The Frequentist solution does not depend on the actual data but on the hypothesis. The Bayesian posterior depends upon the actual data that was collected so you can't create a test table until after you see the data unless you would calculate it for all possible cases.

We are going to assume that you saw six heads. You take the prior and multiply it by the likelihood function, which in this case is the binomial, which gives you the product which is the numerator. You sum all possible hypotheses as your normalization constant and divide each hypothesis by it to form your posterior mass function. It isn't a density because it isn't a continuous variable.

The test distribution is in the chart below.
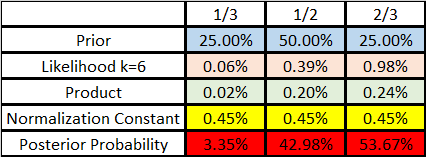
Bayesian Binomial Posterior

Notice that the solutions are different. This isn't merely because of the prior, they will usually be different. In fact, it isn't uncommon for something to be statistically significant with a Frequentist test and not with a Bayesian test.

The meaning of the p-value is that if your hypothesis is true, then the p-value is the probability of seeing a six, seven or eight by chance alone. By fixing the parameter and treating the data as random, you can reduce the problem to a problem of chance. If you reject the null, it really doesn't mean the null is false, it just means that the observation is very improbable if the null is true so it is probably false. The big issue is that the concern is about the falseness of something and not the truth. Your p-value is p<1.71%. The less than sign is present because this is also a minimax distribution.

Because you are assuming there is no valuable prior knowledge, you need to minimize the maximum loss that could be created by acting on the knowledge created by the data. Frequentist p-values are not true probability distributions, but rather worst-case distributions, if the null is true.

The meaning of the Bayesian posterior is that given the actual result, the probability that $\pi=1/3$ is 3.35%. It is unlikely that it is the true value, but there is a small chance it is the actual value. Notice though that if you had not called the Mint, then your posterior probability would have been 4.47%. That is the subjective component. Different people with different information or prior knowledge will get different results.

Because of this, they are not interchangeable. In the Frequentist conceptualization, the data is random but the parameter is fixed when you choose a null. In the Bayesian conceptualization, the data is not random, it is fixed because you saw it, but the parameter is uncertain. In Bayesian thinking uncertainty and randomness is the same thing, while in the Frequentist thought chance and randomness are the same things.

There is one last difference. The Frequentist and the Maximum Likelihood estimator is $\hat{\pi}=6/8=.75,$ which is not possible. Another aspect of Frequentist estimators is that the result can be physically impossible. The Bayesian result though is the entire posterior mass function. Instead of a point, you get three possible answers with attached probabilities. You can get a point estimator by assuming there is some cost to being wrong. Without going into the math, the appropriate cost function is called the all-or-nothing cost function. The most probable answer would be the one you use, which in this case is that $\pi=2/3$. It can never happen that a Bayesian solution cannot happen. It is a biased estimator though. It is biased by the prior. As a strong rule of thumb, all Bayesian solutions are biased.

$\endgroup$
2
  • $\begingroup$ I like the answer (especially the last two paragraphs fit my taste), but I think it is a little biased towards favouring the Bayesian approach. For the Frequentist test, you have three possible hypotheses in the set {π=1/3,π=1/2,π=2/3}. You can only choose one. Isn't this too restrictive? I doubt this is a good illustration of what a frequentist would do in this situation. (That is my gut feeling and I may of course be wrong.) $\endgroup$ Commented Aug 29, 2018 at 15:19
  • $\begingroup$ The Frequentist solution does not depend on the actual data but on the hypothesis. The Bayesian posterior depends upon the actual data. Not sure what you mean by solution, but the frequentist test statistic depends on the data just as the Bayesian posterior does. Frequentist p-values are not true probability distributions, but rather worst-case distributions, if the null is true. P-values as distributions? This might be nitpicky, but could you rephrase it to make it formally correct? $\endgroup$ Commented Aug 29, 2018 at 15:19

Your Answer

By clicking “Post Your Answer”, you agree to our terms of service and acknowledge you have read our privacy policy.

Not the answer you're looking for? Browse other questions tagged or ask your own question.