22
$\begingroup$

I have 10 years of daily returns data for 28 different currencies. I wish to extract the first principal component, but rather than operate PCA on the whole 10 years, I want to rollapply a 2 year window, because the currencies' behaviours evolve and so I wish to reflect this. However I have a major problem, that is that both the princomp() and prcomp() functions will often jump from positive to negative loadings in adjacent PCA analyses (ie 1 day apart). Have a look at the loading chart for the EUR currency:
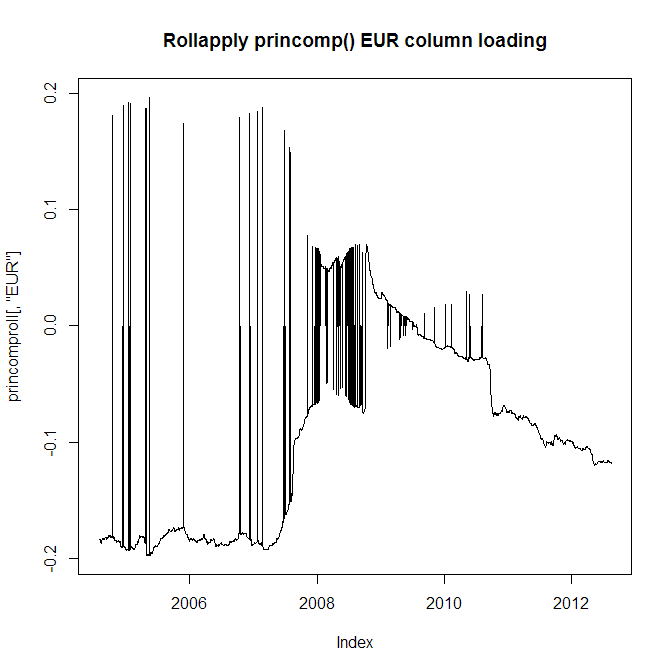
enter image description here

Clearly I can't use this because adjacent loadings will jump from positive to negative, so my series which uses them will be erroneous. Now take a look at the absolute value of the EUR currency loading:
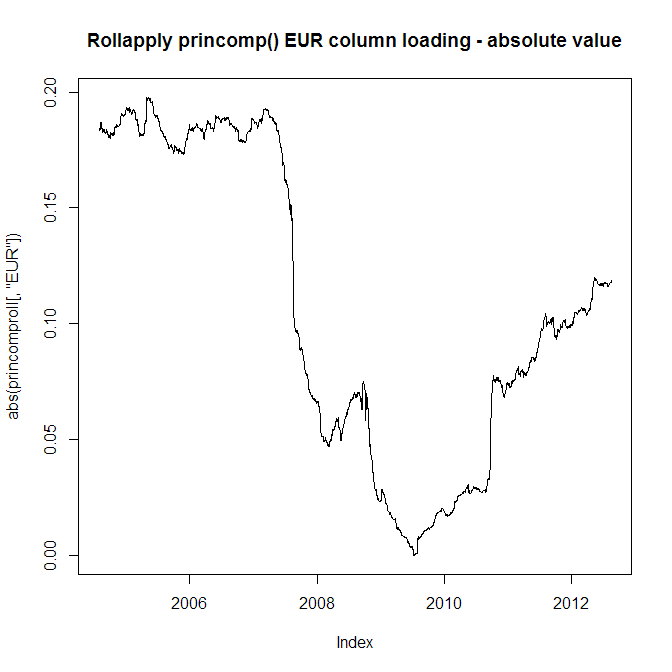
enter image description here

The problem is of course that I still cannot use this because you can see from the top chart that the loading does go from negative to positive and back at times, a characteristic which I need to preserve.

Is there any way I can get around this problem? Can I force the eigenvector orientation to always be the same in adjacent PCAs?

By the way this problem also occurs with the FactoMineR PCA() function. The code for the rollapply is here:

rollapply(retmat, windowl, function(x) 
  summary(princomp(x))$loadings[, 1], by.column = FALSE, 
  align = "right") -> princomproll
$\endgroup$
8
  • 3
    $\begingroup$ Could you explain what you mean by eigenvector "orientation"? As far as I know, there is no such thing that is intrinsic to the data. (That's one reason why different software will produce different normalized eigenvectors.) So it sounds like you're asking for something that does not exist and is meaningless. $\endgroup$
    – whuber
    Commented Aug 15, 2012 at 20:20
  • 1
    $\begingroup$ Well on one day I'll get loadings like this: EUR -0.2 ZAR +0.8 USD +0.41 ..... 28 currencies. And the next day I'll get EUR +0.21 ZAR -0.79 USD -0.4 etc. So the axis that the PCA has chosen to rotate the data onto is oriented exactly the opposite way on day 2, compared with day 1. That is causing these loading jumps and I wish to avoid it, somehow......Apologies if my terminology is misleading. I understand that the PCA code doesn't really care about the axis orientation as long as it is consistent across loadings on one day, but I need it to be consistent across multiple days. $\endgroup$ Commented Aug 15, 2012 at 20:23
  • 1
    $\begingroup$ keeping in mind that from one day to the next, given a rolling 2 year window on daily data, we should have very, very similar PCA. $\endgroup$ Commented Aug 15, 2012 at 20:26
  • $\begingroup$ I think the reason that you have a problem is that this rollapply idea doesn't make sense. I have no solution other than to look for something different that may achieve your goals (not sure what they are) and is sensible. $\endgroup$ Commented Aug 15, 2012 at 20:38
  • $\begingroup$ EUR -0.2 ZAR +0.8 USD +0.41 and EUR +0.21 ZAR -0.79 USD -0.4 are very very similar. You simply invert sign in any of the two results. $\endgroup$
    – ttnphns
    Commented Aug 15, 2012 at 20:46

3 Answers 3

27
$\begingroup$

Whenever the plot jumps too much, reverse the orientation. One effective criterion is this: compute the total amount of jumps on all the components. Compute the total amount of jumps if the next eigenvector is negated. If the latter is less, negate the next eigenvector.

Here's an implementation. (I am not familiar with zoo, which might allow a more elegant solution.)

require(zoo)
amend <- function(result) {
  result.m <- as.matrix(result)
  n <- dim(result.m)[1]
  delta <- apply(abs(result.m[-1,] - result.m[-n,]), 1, sum)
  delta.1 <- apply(abs(result.m[-1,] + result.m[-n,]), 1, 
                   sum)
  signs <- c(1, cumprod(rep(-1, n-1) ^ (delta.1 <= delta)))
  zoo(result * signs)
}

As an example, let's run a random walk in an orthogonal group and jitter it a little for interest:

random.rotation <- function(eps) {
  theta <- rnorm(3, sd=eps)
  matrix(c(1, theta[1:2], -theta[1], 1, theta[3], 
                 -theta[2:3], 1), 3)
}
set.seed(17)
n.times <- 1000
x <- matrix(1., nrow=n.times, ncol=3)
for (i in 2:n.times) {
  x[i,] <- random.rotation(.05) %*% x[i-1,]
}

Here's the rolling PCA:

window <- 31
data <- zoo(x)
result <- rollapply(data, window, 
  function(x) summary(princomp(x))$loadings[, 1], 
               by.column = FALSE, align = "right")
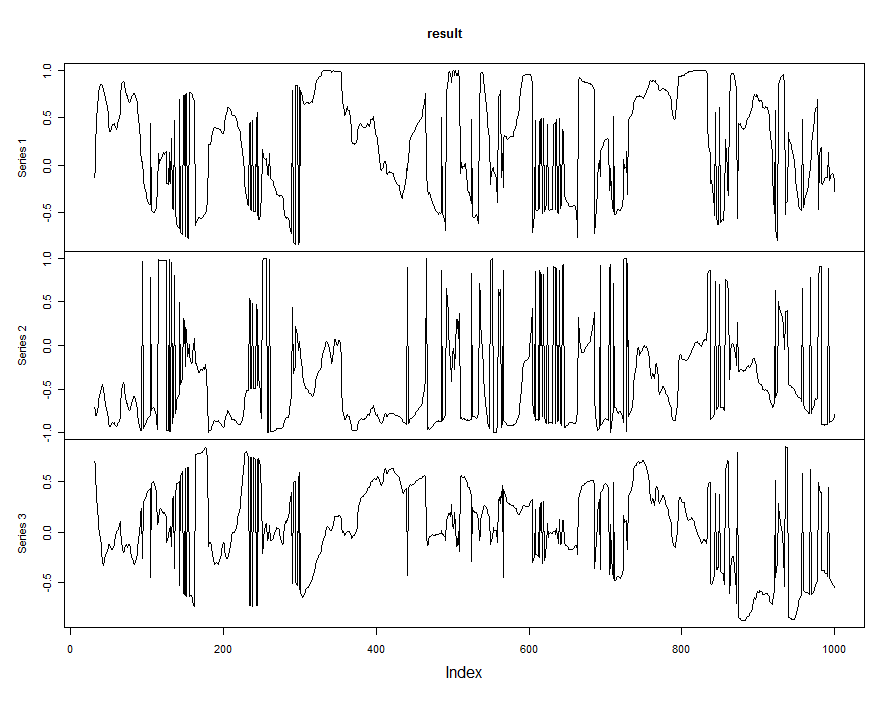
plot(result)

Original

Now the fixed version:

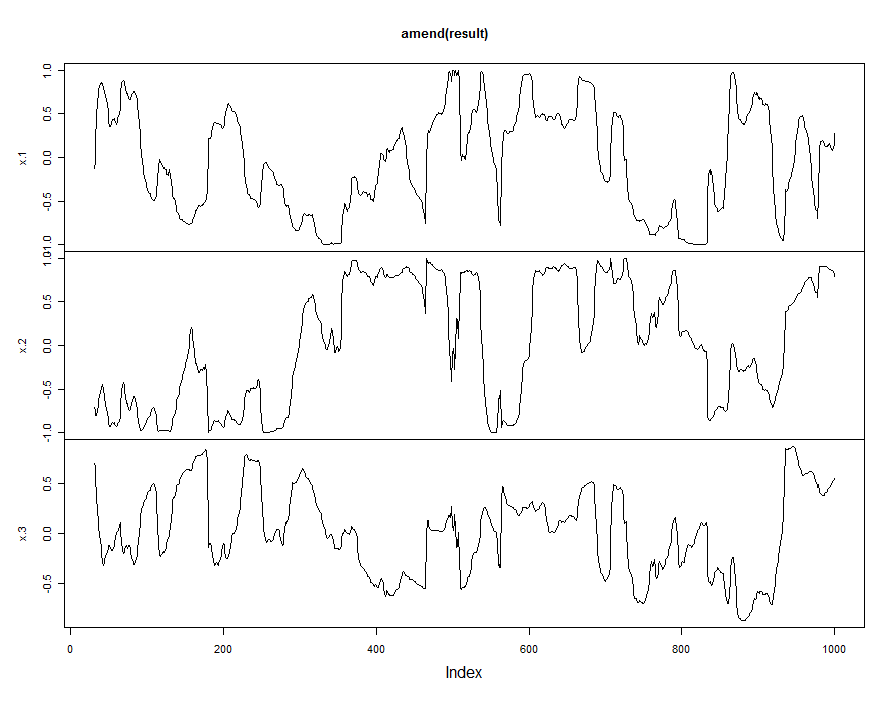
plot(amend(result))

Amended

$\endgroup$
12
  • 2
    $\begingroup$ I upvoted this great answer a long time ago, but now came back to it because I had to implement something similar myself. The approach that I chose (before looking in your post again) was to go through all timepoints $t_i$ and compute the dot product between the leading eigenvector $\mathbf v_{i+1}$ (first PC axis) on the timestep $i+1$ and the eigenvector $\mathbf v_{i}$ on the previous step $i$. If this dot product is close to $1$, do nothing. It it is close to $-1$, flip the direction of $\mathbf v_{i+1}$. Your algorithm seems to be a bit different. Would it work the same way? $\endgroup$
    – amoeba
    Commented Jan 8, 2015 at 16:43
  • 1
    $\begingroup$ @Art, but what does it mean for the very first vector to be "correct"? We know that the sign of this vector is arbitrary. It seems that the whole matter is only to make the signs consistent across different positions of a sliding window, but the initial sign in the first window remains arbitrary. $\endgroup$
    – amoeba
    Commented Jun 18, 2015 at 7:59
  • 2
    $\begingroup$ @Art, so as I understand it, you want to fix the sign of the component based on some external (external to PCA) preferences. This is fine, but that is how you should approach it. First do the sliding PCA thing, making sure that the signs are consistent. And then decide, based on some additional criteria, whether to flip the whole component or not. E.g. you can correlate it with the euro trend and if the correlation is negative, flip the component. Or something like that. This entirely depends on your specific application and on your domain knowledge. $\endgroup$
    – amoeba
    Commented Jun 18, 2015 at 17:20
  • 2
    $\begingroup$ I agree with @amoeba's interpretation and recommendation. $\endgroup$
    – whuber
    Commented Jun 18, 2015 at 17:42
  • 1
    $\begingroup$ @amoeba : yes, you are right about this, although, I naively thought that there might be some generic solution that is not dependent on specific time series, something like "real orientation of the vector" :) anyway, thank you for help and suggestions $\endgroup$
    – Anonymous
    Commented Jun 18, 2015 at 20:35
7
$\begingroup$

@whuber is right that there isn't an orientation that's intrinsic to the data, but you could still enforce that your eigenvectors have positive correlation with some reference vector.

For instance, you could make the loadings for USD positive on all your eigenvectors (i.e., if USD's loading is negative, flip the signs of the entire vector). The overall direction of your vector is still arbitrary (since you could have used EUR or ZAR as your reference instead), but the first few axes of your PCA probably won't jump around nearly as much--especially because your rolling windows are so long.

$\endgroup$
5
  • 8
    $\begingroup$ Good idea. I tried this first (probably while you were posting this answer :-). The problem is that the other loadings can jump around. To fix this, base the sign choice on the largest loading. Still no dice: the loadings can still jump. The trick is at each time to choose the orientation that creates the least disturbance in the vector of loadings from the previous time. $\endgroup$
    – whuber
    Commented Aug 15, 2012 at 21:57
  • 4
    $\begingroup$ @whuber Nice work. $\endgroup$ Commented Aug 16, 2012 at 0:17
  • 1
    $\begingroup$ Correct, the sign of loadings doesn't matter (orientation). Something that was not addressed was that if you perform this across different software packages, the between-package differences is that one program may result in negative(positive) signs on particular loadings while another results in positive(negative) signs for the same loadings. Therefore, the signs of the final results in the 3-series plot above could be inverted when using another package. The reference vector loadings could also have a sign change - and this solution would not be incorrect. $\endgroup$
    – user32398
    Commented Jan 29, 2014 at 12:47
  • $\begingroup$ @LEP : I faced the same problem with inversion, maybe you have already found solution for this issue - how to find out that first vector is correct and make sure that the rest will be aligned to it properly - quant.stackexchange.com/questions/3094/… ? $\endgroup$
    – Anonymous
    Commented Jun 18, 2015 at 0:32
  • 1
    $\begingroup$ As long as the matrix is not singular and none of the eigenvalues are zero, most algorithm results should be the same, except for a 180 degree change in the signs - which is not guaranteed. $\endgroup$
    – user32398
    Commented Jun 20, 2015 at 1:33
1
$\begingroup$

What I did was to compute the L1 distance between successive eigenvectors. After normalizing this matrix I choose a z score threshold e.g. 1, so that if in any new rolling the change is above this threshold I flip the eigenvector, factors and loadings in order to have consistency in the rolling window. Personally I don't like to force given signs in some correlations since they can be very volatile depending of the macro drivers.

$\endgroup$

Not the answer you're looking for? Browse other questions tagged or ask your own question.