Let's say I have a likelihood function for a vector X.
I get this as dnorm(X, mean(X), sd(X)
Obviously the MLE will be the mean here.
But let's say I want to compare some other value, like 4, to the MLE. I do dnorm(4, mean(X), sd(X)
Then -2*log(prod(dnorm(X, mean(X), sd(X))/prod(dnorm(4, mean(X), sd(X))) to get the log likelihood ratio.
Since the chi-squared test degrees of freedom for the likelihood ratio statistic is # parameters-#parameters ( zero) or 1 or the same as the t-distribution 1-n (149 for the vector I'm playing with in R, iris$Sepal.Width).
But I can't get the proper p-values with any of the chisq functions in R with any of these degrees of freedom.
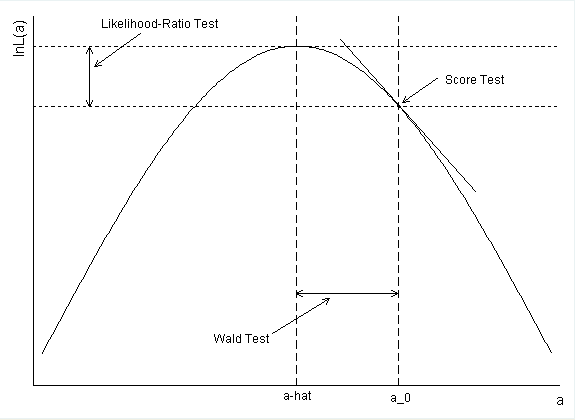
Basically, I'm trying to recreate the one sample t-test using the likelihood ratio test. I know that the one sample t-test IS the likelihood ratio test for a mean with unknown variance but I'm trying to understand the math/logic of how you get from the LRT with its use of chi-squared sampling distribution to the t-test. I know the t-test is essentially the wald test, but the wald test evaluates distance on the likelihood function on the horizontal scale, not vertical (see photo). Or should I expect different p-values?

