2
$\begingroup$

I have a number of data sets each containing the measurement of all trees diameter within one hectare.

A Weibull function distribution is fitted to the data and for each data set I obtain the parameters shape and scale and the standard deviation for each parameter.

How can I compare the shape and scale parameters to determine which of these distributions are statistically different, in other words the distribution of tree diameters is different? All distributions are non-normal and the data sets are independent from each other. I do not have confidence interval.

Can I say that two distributions are different if the standard deviation from one distribution does not overlap with the shape and scale parameters from the other distribution? Or should the standard deviations from both distribution not overlap? Or is there some formal statistical test to be done?

$\endgroup$
0

1 Answer 1

2
$\begingroup$

If the null hypothesis is that the distributions in the two groups are equal, the alternative that they are different, you can estimate the weibull parameters under the two distributions, and compute a likelihood ratio test. Look at fit GLM for weibull family and its answers.

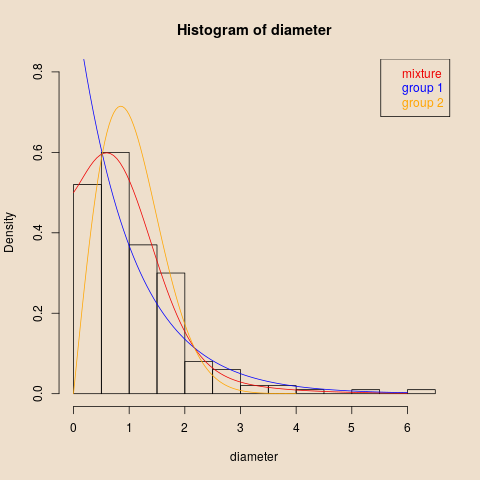
In your case, you would create variables diameter containing the measured diameters for both groups, and an indicator variable group (factor) with values 1 and 2. The R glm function do not have a weibull family, but the gamlss package do have (multiple ones, with different parameterization). Setting up and simulating some data:

set.seed(7*11*13)
diameter <- c(rweibull(100,1,1),rweibull(100,2,1.2))
group <- c(rep(1,100),rep(2,100))
simdata <- data.frame(diameter=diameter, group=as.factor(group))    

library(MASS)
library(gamlss) 

Then fitting the two nested models, and calculating the likelihood ratio test:

mod1 <- gamlss(diameter ~ 1, family=WEI(), data=simdata)
...
mod2 <- gamlss(diameter ~ group, diameter ~ group, family=WEI(), data=simdata)
...
LR.test(mod1, mod2)
 Likelihood Ratio Test for nested GAMLSS models. 
 (No check whether the models are nested is performed). 

       Null model: deviance= 424.7234 with  2 deg. of freedom 
 Alternative model: deviance= 373.4748 with  4 deg. of freedom 

 LRT = 51.24854 with 2 deg. of freedom and p-value= 7.439049e-12 

so the null hypothesis of equal distribution in the two groups is clearly rejected.

Finally we show some plots of the data: enter image description here

$\endgroup$
1
  • 1
    $\begingroup$ It seems a reasonable way to do this, I will try it. Thanks $\endgroup$ Commented Jun 28, 2018 at 11:45

Your Answer

By clicking “Post Your Answer”, you agree to our terms of service and acknowledge you have read our privacy policy.