6
$\begingroup$

Six raters independently rated 25 people by identifying strengths and weaknesses: choosing among 35 traits (15 positive traits and 20 negative traits). The rater instructions said to identify a maximum of the 3 greatest strengths and the 3 greatest weaknesses for each person. On average, a person received about 3 strength or weakness ratings from a rater (less than the 6 expected based on the rater instructions).

How might I go about describing the degree of rater agreement? (The options that come to mind are % agreement and some index of inter-rater reliability.)

My primary interest is in the person level agreement, since the people involved are interested in knowing whether the raters are giving them valuable information. The overall level of agreement is also of interest.

Update: A Possible Approach:

This dilemma seems to have 2 separate aspects: (a) developing a measure of the level of rater agreement, and (b) developing a way to compare the observed level of rater agreement to chance. Here is an approach that I describe in hope of getting constructive feedback.

(a) Rater Agreement Ratio

Define rater agreement as the ratio of the total number of attributes selected by the raters (counting each time an attribute is chosen, whether or not the attribute is chosen by multiple raters) to the total number of unique attributes selected (counting each chosen attribute once, no matter how many raters chose that attribute)

Since there are 6 raters, if all raters chose the same attributes, the ratio would be 6.0. For example, if all 6 raters chose attributes 1 and 3, the rater agreement ratio would be 12/2=6. If all raters chose different attributes, the ratio would be 1.0. For example, if the 6 raters chose 18 different attributes, the rater agreement ratio would be 18/18=1.0. So this measure could range from 1) no agreemnt0 to 6 (perect agreement).

(b) Distribution of rater agreement ratio based on chance

Calculate the extent of agreement that would be seen based on chance using a Monte Carlo study, as follows. For each rater, tally the attributes chosen to get a frequency distribution of the positive and negative attributes chosen.
Use these frequency distributions to calculate level of agreement that would be observed based on chance, as follows. If rater A chose 3 positive and 2 negative attributes for person 1, select 3 positive and 2 negative attributes from these two pools of attributes for rater A: (1) all the positive attributes chosen by rater A for all people, and (2) all the negative attributes chosen by rater A for all people, in both cases allowing for frequency of attribute choices. Repeat this for Raters B through F. Then calculate the rater agreement ratio due to chance. Repeat this multiple times (Monte Carlo approach) to get the degree of agreement expected based on chance and the probability distribution of the rater agreement ratio. Compare this with the level of agreement actually observed.

What do you think?

$\endgroup$
4
  • 1
    $\begingroup$ Are you trying to describe agreement for any given person, or some sort of aggregate? Are you asking "For any given person, how much do his/her raters agree?" or "how much do the raters agree in general across all people rated?" $\endgroup$
    – enumaris
    Commented Jun 20, 2018 at 16:51
  • $\begingroup$ @enumaris TY for the question. My primary interest is in the person level agreement, since the people involved are interested in knowing whether the raters are giving them valuable information. The overall level of agreement is also of interest. $\endgroup$
    – Joel W.
    Commented Jun 20, 2018 at 17:34
  • $\begingroup$ You could model/estimate the probability that a certain strength/weakness is chosen, and the higher this probability (based on the observation that more raters choose it), the more important it is. However, I would not call this rater agreement. When raters 'disagree' then this might not necessarily be due to bad judgment, but it could instead be due to a person having no strong strengths/weakness. $\endgroup$ Commented Jun 22, 2018 at 21:59
  • $\begingroup$ @MartijnWeterings What would to take as indication of rater agreement? $\endgroup$
    – Joel W.
    Commented Jun 29, 2018 at 23:11

2 Answers 2

1
$\begingroup$

You can think about the raters as points that occupy a 35 dimensional space (one dimension for each trait) for each person.

Then, you can measure their degree of agreement by measuring how far apart they are from each other in that space. The distance can be measured using the Euclidean distance (Pythagorean) formula.

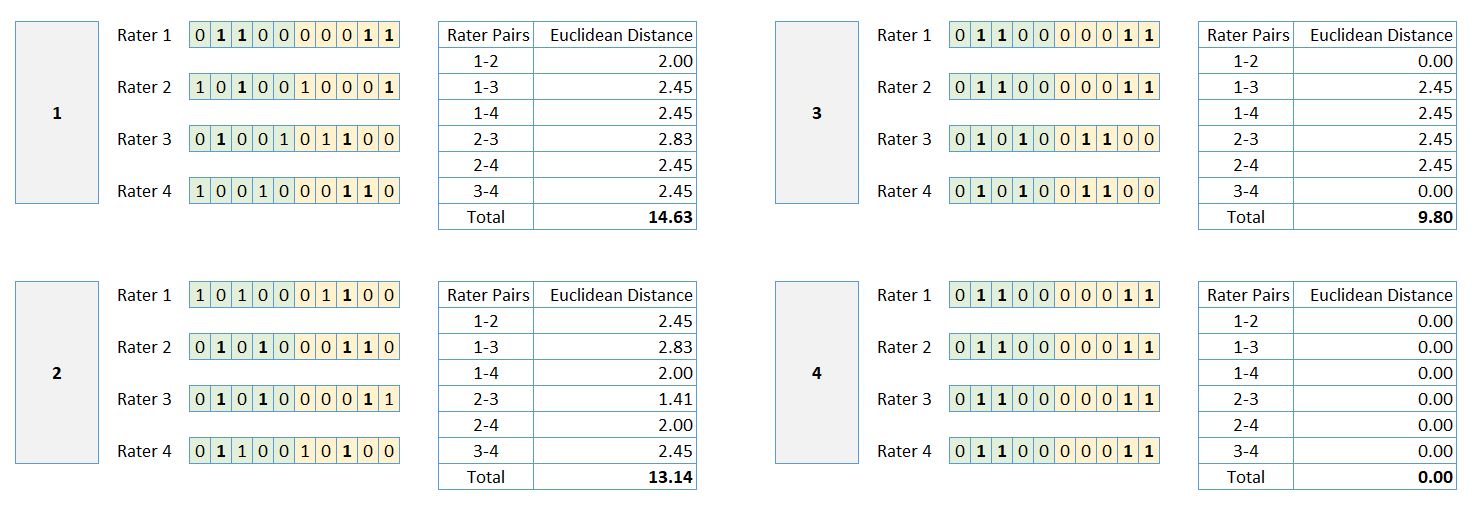
Below are a few examples of four raters rating four people on a total of 10 traits (for brevity). If a rater chose a specific trait, the person gets a score of 1 for that trait, otherwise 0. In this example each rater chose two traits per person.

enter image description here In the first case, all four raters have a very little agreement, and their total Euclidean distance comes out to be 14.63 for this person.

In the second case, there's a little more agreement, and as a result, the total distance reduces to 13.14. The lower the distance, the closer all raters are to each other in this 10 dimensional space.

In the last example, all raters agree with each other, so the total distance is zero. This is the best possible score.

In this example, since there are four raters, there would be a total of six pairs (comparisons) for which the Euclidean distances need to be calculated. In your example, six rater would yield 15 pairs.

For the aggregate measure of agreement, you can take the average distance across all people.

Since the distance measure doesn't really have a very intuitive interpretation (like how a percentage value that goes from 0 to 100 would) -- you might want to create a spectrum that shows the range from lowest to highest score for this dataset.

$\endgroup$
4
  • $\begingroup$ I am unfamiliar with Euclidean distance. How is it calculated and what assumptions is it based on? Also, has it been used before to measure degree of rater agreement? Thank you. $\endgroup$
    – Joel W.
    Commented Jun 24, 2018 at 2:32
  • $\begingroup$ In your example, all the raters chose 2 strengths and 2 weaknesses for each person. Would your suggested solution work if the raters chose different numbers of strengths and weaknesses for each person? $\endgroup$
    – Joel W.
    Commented Jun 25, 2018 at 2:40
  • $\begingroup$ What level of this measure would be expected based on chance? $\endgroup$
    – Joel W.
    Commented Jun 25, 2018 at 10:25
  • $\begingroup$ @JoelW. Unfortunately, I am traveling (on business) this week, and don't have time to respond to your questions or elaborate on my answer. But here's a link that, I think, contains most of the answers you're looking for: econ.upf.edu/~michael/stanford/maeb4.pdf Hope that helps! $\endgroup$
    – Vishal
    Commented Jun 25, 2018 at 14:21
0
+100
$\begingroup$

I think you are on the right track. Below are some thoughts that may be of help.

ad A. The non-standardized Rater Agreement measure that you suggest is called Hamming distance.

The traits ($1 \le k \le 35$) assigned to individual $i$ by rater $j$ can be represented as a binary vector, $v_{ij}$, of length $35$.

Say traits $1, 3, 4$ were assigned to individual $7$ by rater $3$, then $v_{7,3}$ would look like:

$$ [1, \, 0, \, 1, \, 1, \, 0, \, 0, \, 0, \, 0, \, ..., \, 0]. $$

And say rater $4$ assigns traits $1, 3, 5$ to individual $7$, then $v_{7,4}$ is:

$$ [1, \, 0, \, 1, \, 0, \, 1, \, 0, \, 0, \, 0, \, ..., \, 0]. $$

The Hamming distances, $d_H(\cdot, \cdot)$, of these vectors to themselves are $0$; and $1$ to each other:

$$ d_H(v_{7,3}, \, v_{7,3}) = 0, \\ d_H(v_{7,4}, \, v_{7,4}) = 0, \\ d_H(v_{7,4}, \, v_{7,3}) = 1. $$

The Hamming distance between binary vectors is maximal if their intersection$^1$ is minimal (in your case zero). Hamming distance is minimal (zero) if the intersection is maximal, i.e. if the vectors are identical.

ad B. A Monte-Carlo approach may indeed be warranted, though it may also help to know that the probability distribution of the intersection size of two "equal-weighted" binary vectors is Hypergometric.

Say, $w$ is the number of ones (or "weight") of the binary vectors $x, y \in [0, 1]^K$. Then for the weight $W_z$ of the intersection vector, $z$, it holds that:

$$ P(W_z = l) = \frac{\binom{w}{l}\binom{K-w}{w-l}}{\binom{K}{w}} \, , $$

for $\max(0, 2w - K) \le l \le w\,$ (the support of $W_z$).


$^1$ Strictly speaking intersection ($\cap$) is an operation on sets – not vectors. However, binary vectors can (straightforwardly) be interpreted as representing sets. In your case as a set of traits that an individual was assigned ($1$) or not ($0$).

$\endgroup$

Your Answer

By clicking “Post Your Answer”, you agree to our terms of service and acknowledge you have read our privacy policy.

Not the answer you're looking for? Browse other questions tagged or ask your own question.