I am working on a project that predicts the Market Cap (value) of different crypto-currencies. My data is very small (51 observations) and I initially have 18 X-variables. I was hoping to get feedback on my modeling approach and results, and suggestions on improving the model (particularly by transforming variables / with a non-linear regression) technique. I will do my best to keep the post clear and brief, and hope it can be helpful to others working on a similar analysis. The post may seem long, but a lot of it is images. Also, I am doing this in R, and can share any code on request.
1.) My first action was to log-transform the Market Cap (Y-variable) into log(Market Cap). Here are 2 graphs, of Market Cap and of log(Market Cap) of my 50 observations:
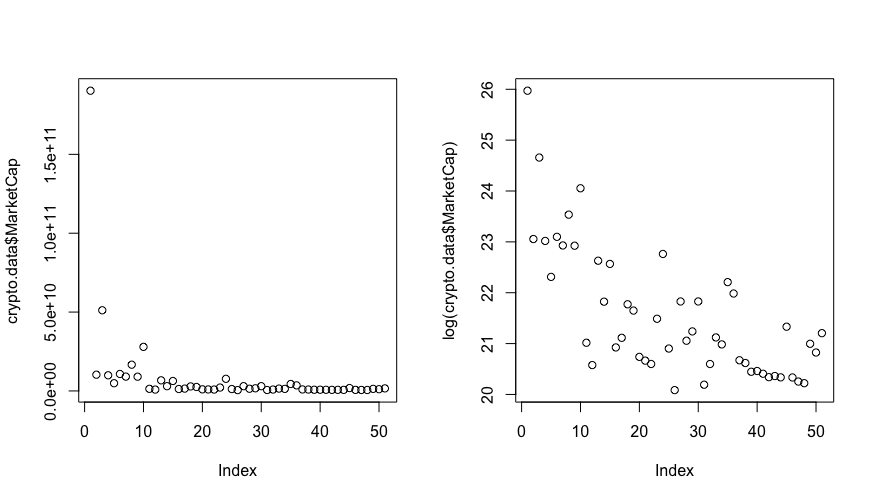
...the outlier point, with a $190B market cap, is bitcoin, and the model badly overfit to this data point if I did not log-transform. For this reason, I think this first action of log-transforming the Market Cap is a good action.
2.) 12 of the 50 observations were missing values for 6 of the X-variables. Rather than throwing these observations away, I predict missing values for these 6 X-variables by fitting, for each of these 6 X-variables, a simple linear regression between the (a) the X-variable with missing values, and (b) one of the remaining 12 X-variables with no missing values. For (b), I chose the X-variable with the highest pearson correlation to the missing-value-X-variable. I use this simple linear regression to predict missing values.
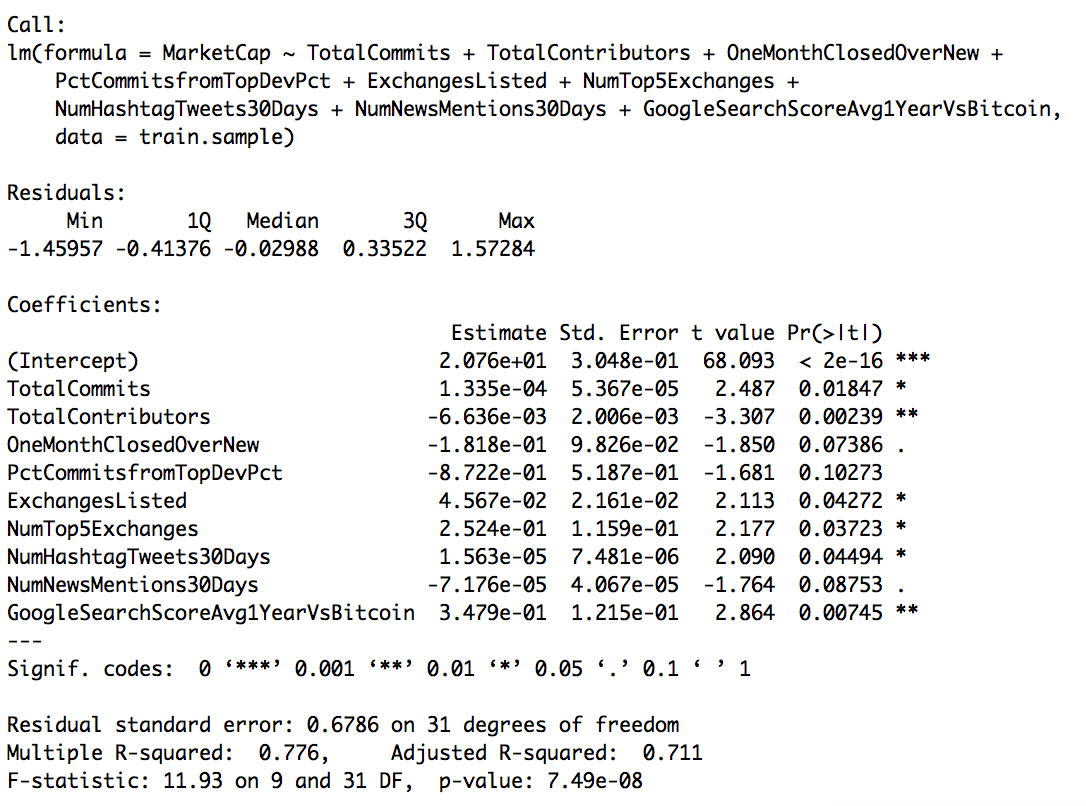
3.) I then fit an initial linear model with all 18 variables. However, since 18 variables will almost certainly overfit to 50 data points, and because there is some multicollinearity to the X-variables, I then use stepwise regression with backward elimination to fit a model with fewer variables. The R summary output of the model returned using backward elimination, with 9 variables, is here:
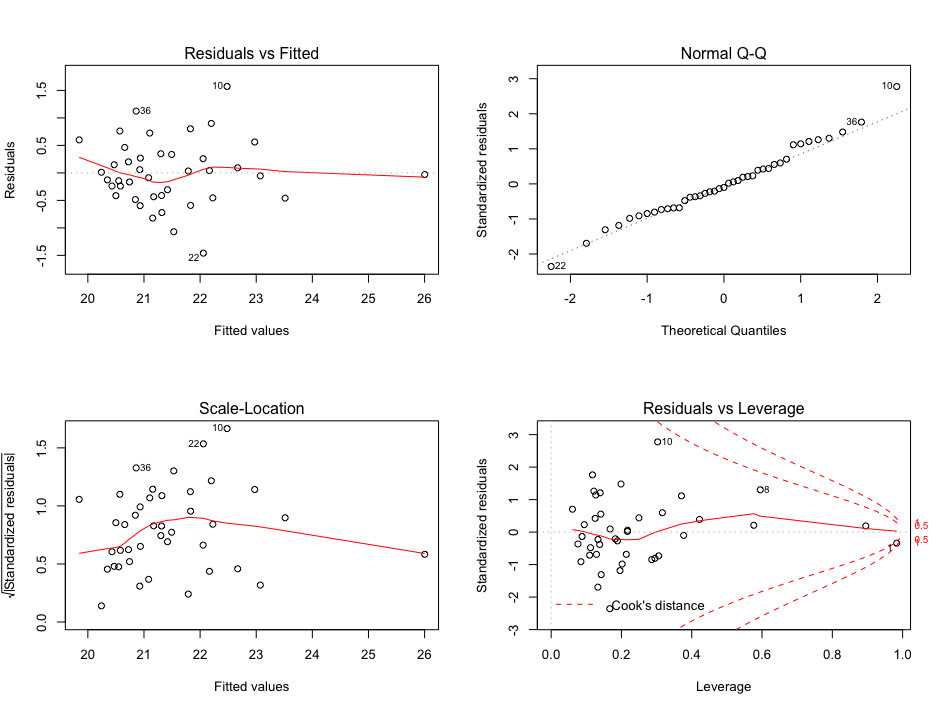
and the R diagnostics plots from this model are:
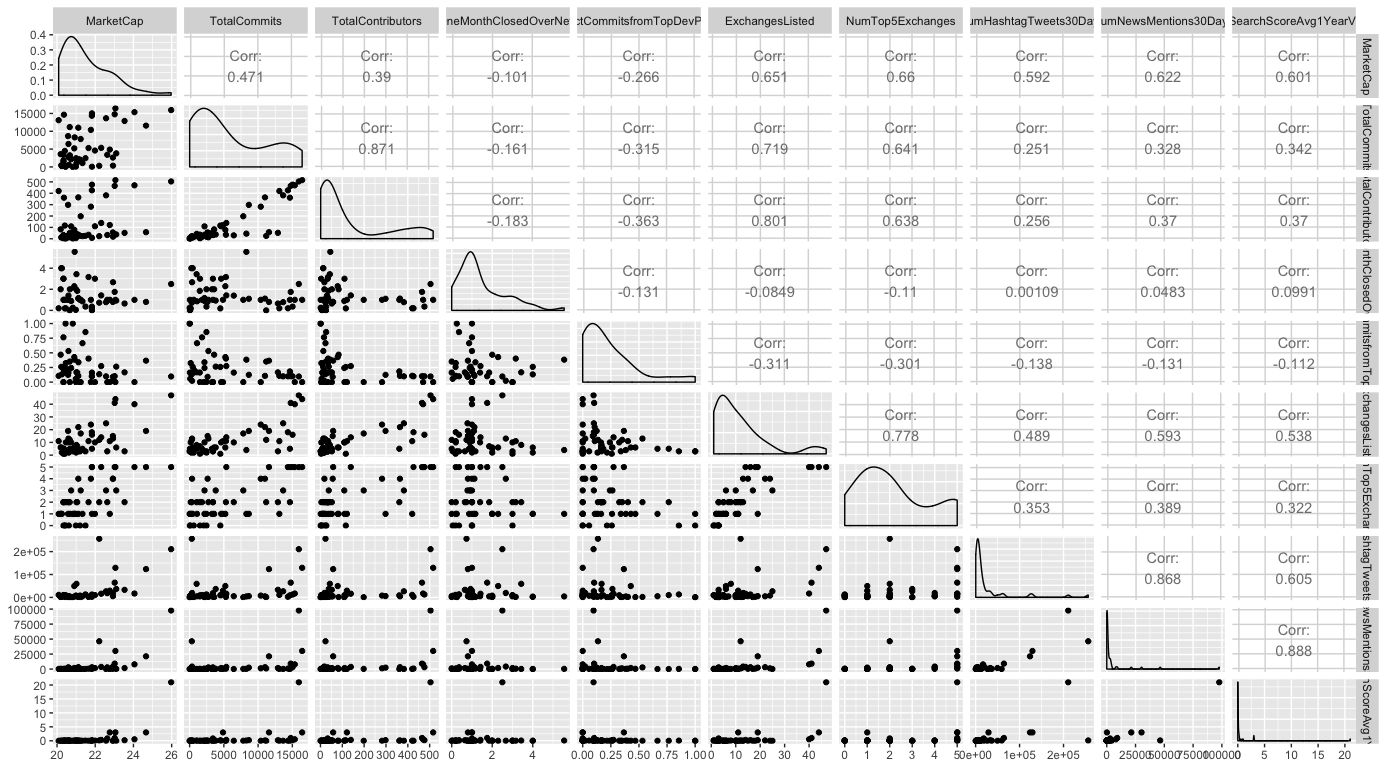
4.) Lastly, here is a grid with variable distributions and correlations for these 9 predictor variables + the log(Market Cap):
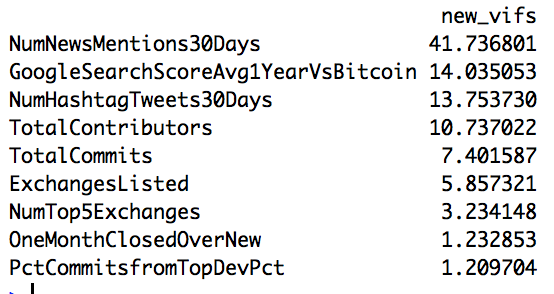
as well as a table of Variance Inflation Factors
My thoughts on next steps are to fix the remaining multicollinearity issue by removing additional variables, and also remove some outlier data points indicated in the Residuals vs. Leverage graph. I also plan to test the model on a test data-set (I did a 40 / 10 split), 5 times using 5-fold cross validation.
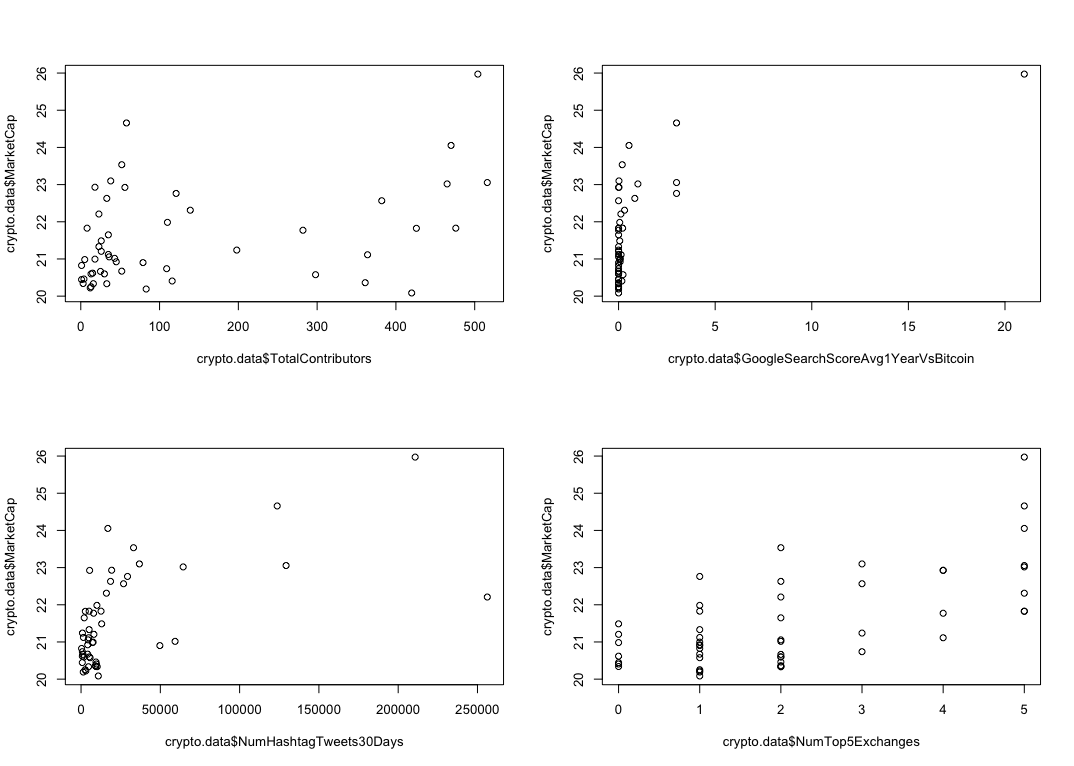
I am interested in anyone's thoughts on transforming the X-variables, which I currently do none of. The grid of histograms / correlations / scatter plots shows that many variables are right-skewed. Additionally, I have graphed the simple linear regression fit between log(Market Cap) and each of the 9 remaining variables, and received these plots (for 4 of the 9):
And noticed for the most part that none of the X-variables seem to have a great linear-fit with log(Market Cap).
Any thoughts on next-steps on my model building would be greatly, greatly appreicated. Apologies again for the long post, but I felt that thorough / lots of images / plots would be helpful here. Thanks!

