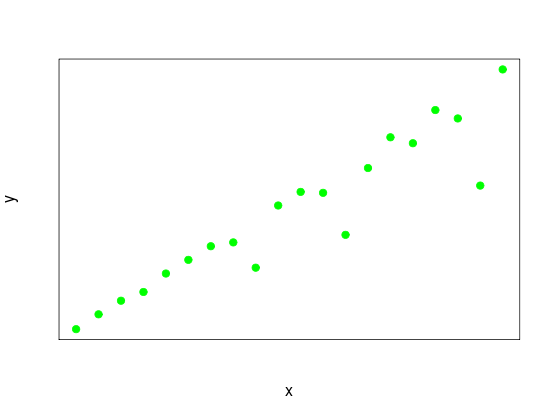
For plot 1, I can test the association between x and y by doing a simple correlation.

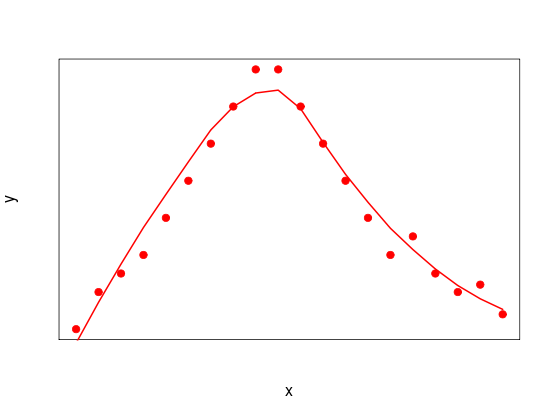
For plot 2, where the relationship is nonlinear yet there is a clear relation between x and y, how can I test the association and label its nature?

For plot 1, I can test the association between x and y by doing a simple correlation.

For plot 2, where the relationship is nonlinear yet there is a clear relation between x and y, how can I test the association and label its nature?

...the relationship is nonlinear yet there is a clear relation between x and y, how can I test the association and label its nature?
One way of doing this would be to fit $y$ as a semi-parametrically estimated function of $x$ using, for example, a generalized additive model and testing whether or not that functional estimate is constant, which would indicate no relationship between $y$ and $x$. This approach frees you from having to do polynomial regression and making sometimes arbitrary decisions about the order of the polynomial, etc.
Specifically, if you have observations, $(Y_i, X_i)$, you could fit the model:
$$ E(Y_i | X_i) = \alpha + f(X_i) + \varepsilon_i $$
and test the hypothesis $H_{0} : f(x) = 0, \ \forall x$. In R, you can do this using the gam() function. If y is your outcome and x is your predictor, you could type:
library(mgcv)
g <- gam(y ~ s(x))
Typing summary(g) will give you the result of the hypothesis test above. As far as characterizing the nature of the relationship, this would be best done with a plot. One way to do this in R (assuming the code above has already been entered)
plot(g,scheme=2)
If your response variable is discrete (e.g. binary), you can accommodate that within this framework by fitting a logistic GAM (in R, you'd add family=binomial to your call to gam). Also, if you have multiple predictors, you can include multiple additive terms (or ordinary linear terms), or fit multivariable functions, e.g. $f(x,z)$ if you had predictors x, z. The complexity of the relationship is automatically selected by cross validation if you use the default methods, although there is a lot of flexibility here - see the gam help file if interested.
If the nonlinear relationship had been monotonic, rank correlation (Spearman's rho) would be appropriate. In your example there is a clear small region where the curve changes from monotonically increasing to monotonically decreasing like a parabola would do at the point where the first derivative equals $0$.
I think if you have some modeling knowledge (beyond the empirical information) where that change point occurs (say at $x=a$) then you can characterize the correlation as positive and use Spearman's rho on the set of $(x,y)$ pairs where $x < a$ to provide an estimate of that correlation and use another estimate of Spearman's correlation for $x>a$ where the correlation is negative. These two estimates then characterize the correlation structure between $x$ and $y$ and unlike a correlation estimate that would be near $0$ when estimated using all the data these estimates will both be large and opposite in sign.
Some might argue that just the empirical information (i.e. the observed $(x,y)$ pairs) is enough to justify this.
You can test any kind of dependence by using distance correlation tests. See here for more informations about the distance correlation: Understanding distance correlation computations
And here the original paper: https://arxiv.org/pdf/0803.4101.pdf
In R this is implemented in the energy package with the dcor.test function.
An update on this 12 years after the question was asked.
Tests for nonlinear relationships
If the task is just to test for a relationship with a test that is able to discover any kind of (nonlinear) relationship, there are many (>10) tests for this by now. Let's call them independence tests. Karch et al. (2024) (I am one of the authors) provides an overview of independence tests. To mention a few prominent ones with corresponding R packages,
These independence tests are consistent if the two variables are not independent. Thus, if the two variables are related, their power approaches $1$ as the sample size increases. An important difference compared to nonlinear regression techniques, such as, generalized additive models, as suggested in another answer is thus that independence tests are not limited to testing for an influence of $X$ on the mean of $Y$ but can also find all other dependencies such if $X$ influences the variance of $Y$.
This, of course, poses the question of which independence test to use for a given problem. For finite sample sizes, there are big power differences, and it mostly depends on the form of the relationship (quadratic, exponential,...) which test is best (Karch et al., 2024; de Siqueira Santos et al., 2014). de Siqueira Santos et al., 2014 provides some guidance when there is some knowledge about what relationship to expect. (Karch et al., 2024) and (Simon et al., 2014) concluded that distance correlation tends to perform reasonably well across many relationships.
Test for inverted U
When such specific knowledge about the relationship as in the original question is available, I would not use any of these general tests but instead one tailored to the problem at hand, as it will likely have more power due to being specialized. A peer-reviewed test, for an inverted-U relationship, very much in the spirit of an earlier answer, is https://journals.sagepub.com/doi/full/10.1177/2515245918805755.
I used to implement the general additive model to detect the non-linear relationship between two variables, but recently I've found out about the non-linear correlation implemented via nlcor package in R, you can implement this method in the same way as Pearson correlation, the correlation coefficient is between 0 and 1 and not -1 and 1 as in Pearson correlation. A higher correlation coefficient implies the existence of a strong non-linear relationship. Let's assume two time series x2 and y2, the nonlinear correlation between the two time series is tested as follows
install.packages("devtools")
library(devtools)
install_github("ProcessMiner/nlcor")
library(nlcor)
c <- nlcor(x2, y2, plt = TRUE)
c$cor.estimate
[1] 0.897205
The two variables seem to be strongly correlated via nonlinear relationship, you can also obtain the adjusted p-value for the correlation coefficient
c$adjusted.p.value
[1] 0
You can also plot the results
print(c$cor.plot)
You can view this link for more details