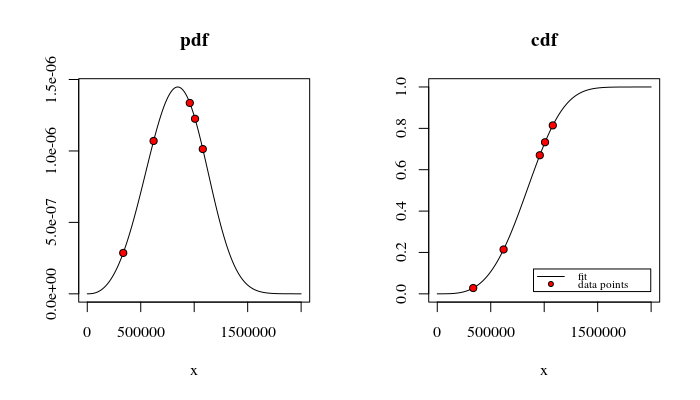
I am doing a Weibull and normal distribution analysis for a set of my data which are :
336256 620316 958846 1007830 1080401
So to avoid putting the whole code here, I refer you directly to the post I followed :
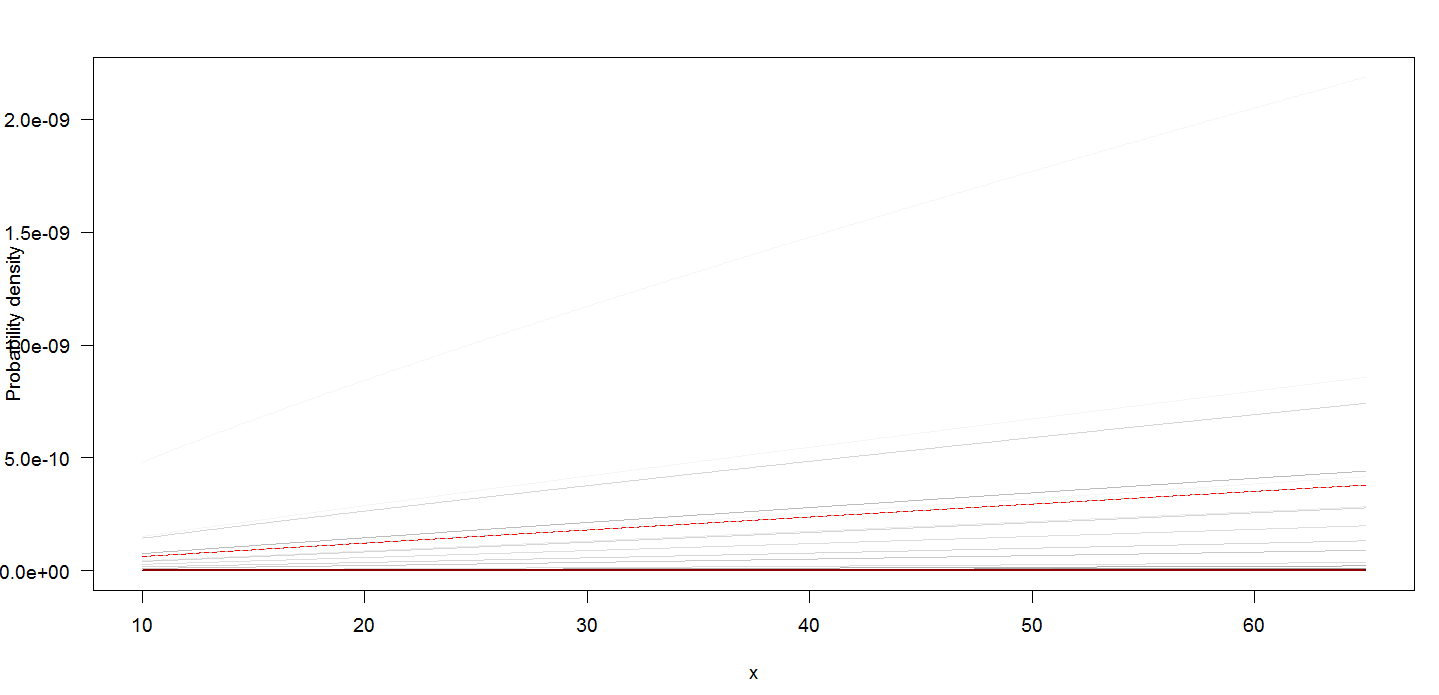
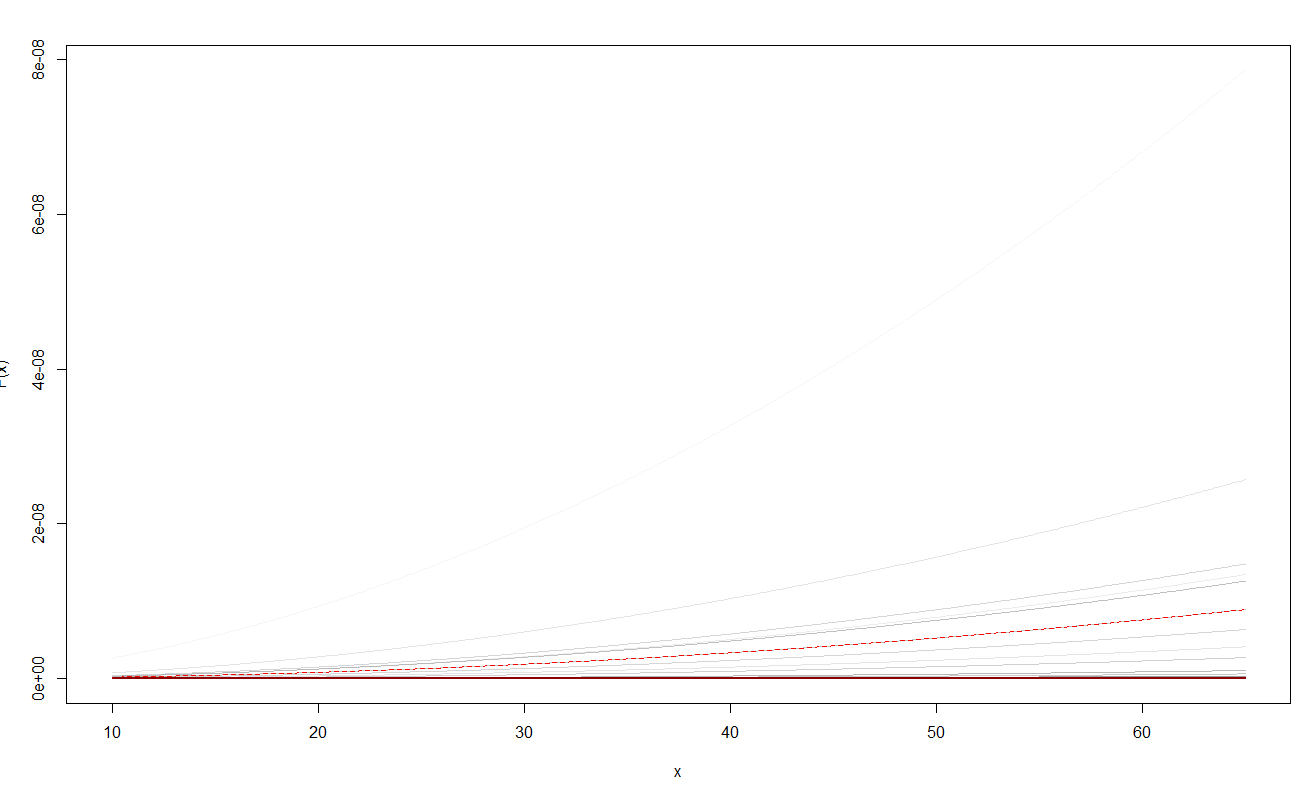
The PDF and CDF plots I get are so small and get this form :
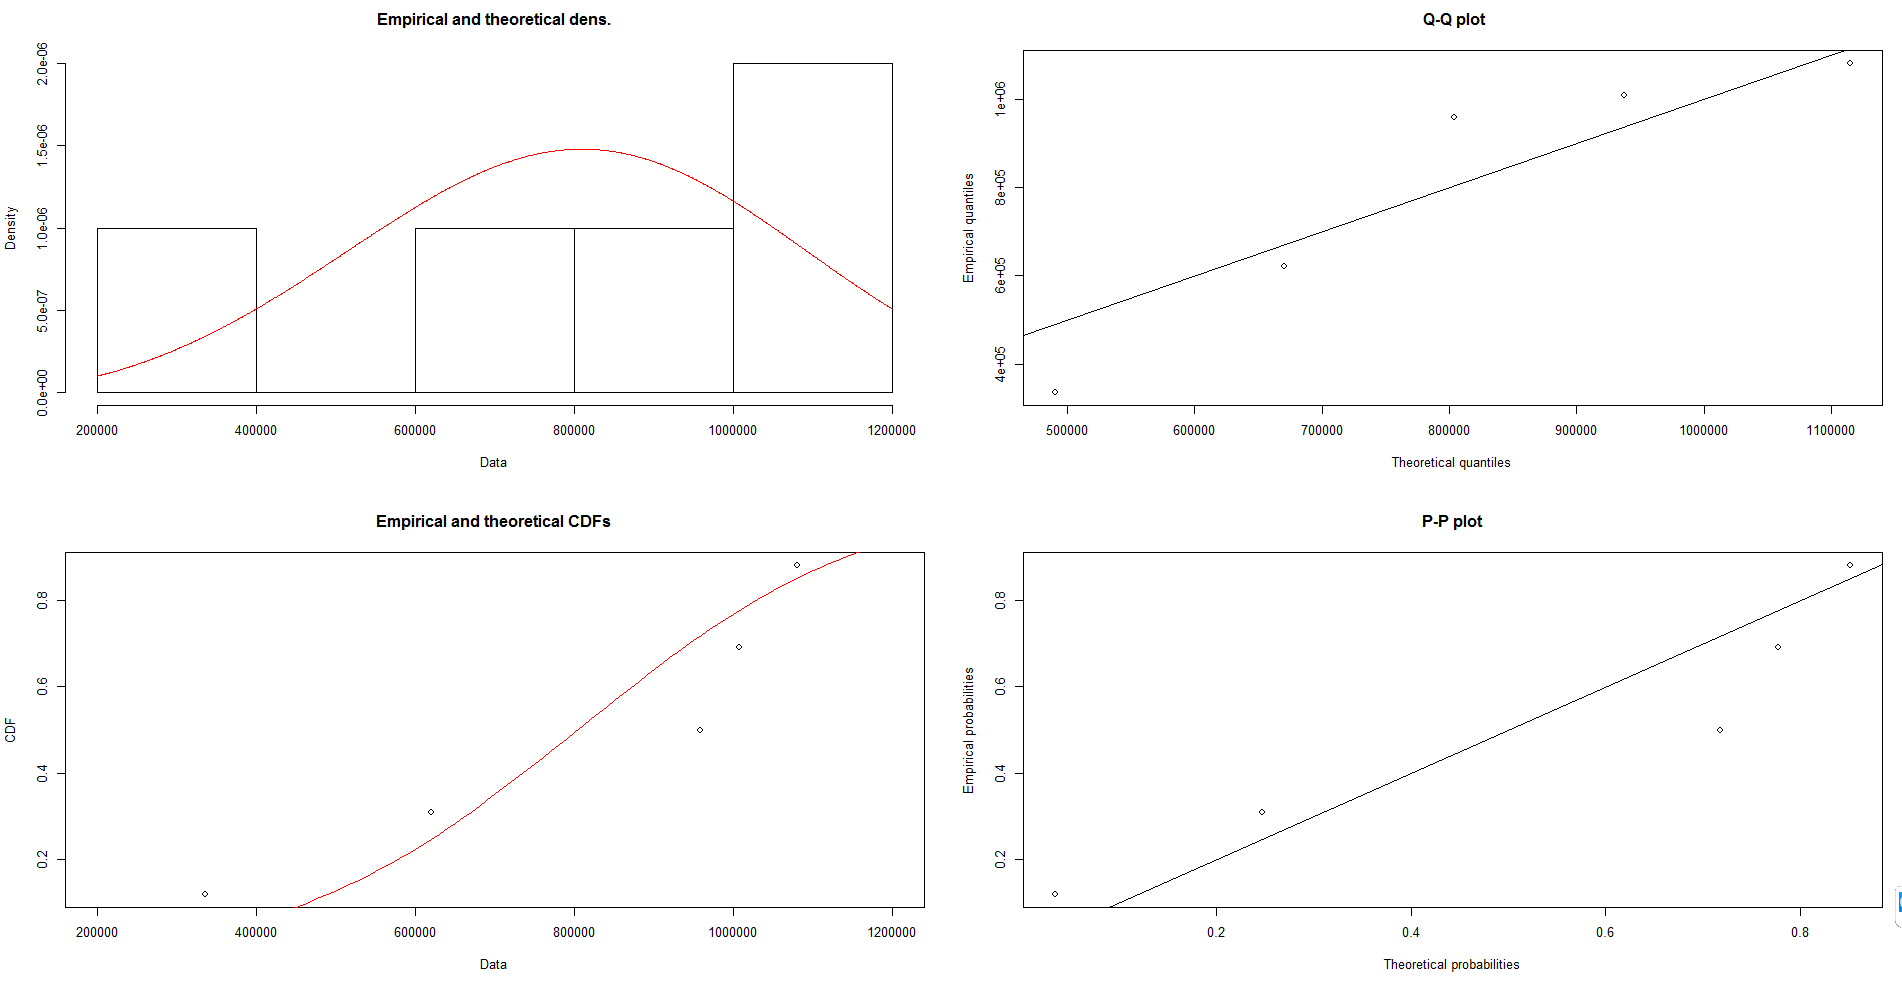
Just as info , I put the Weibull distribution results here , to show the values that are small as well :
update :
as per request I put the code to plot pdf here :
my data are as indicated 336256 620316 958846 1007830 1080401
so to reproduce the code, you need to save it as csv and run this code, on your directory. My problem is that I can change and scale the graphs on
xs <- seq(0, 5, len=500)
by changing to :
xs <- seq(10, 1650000, len=5000)
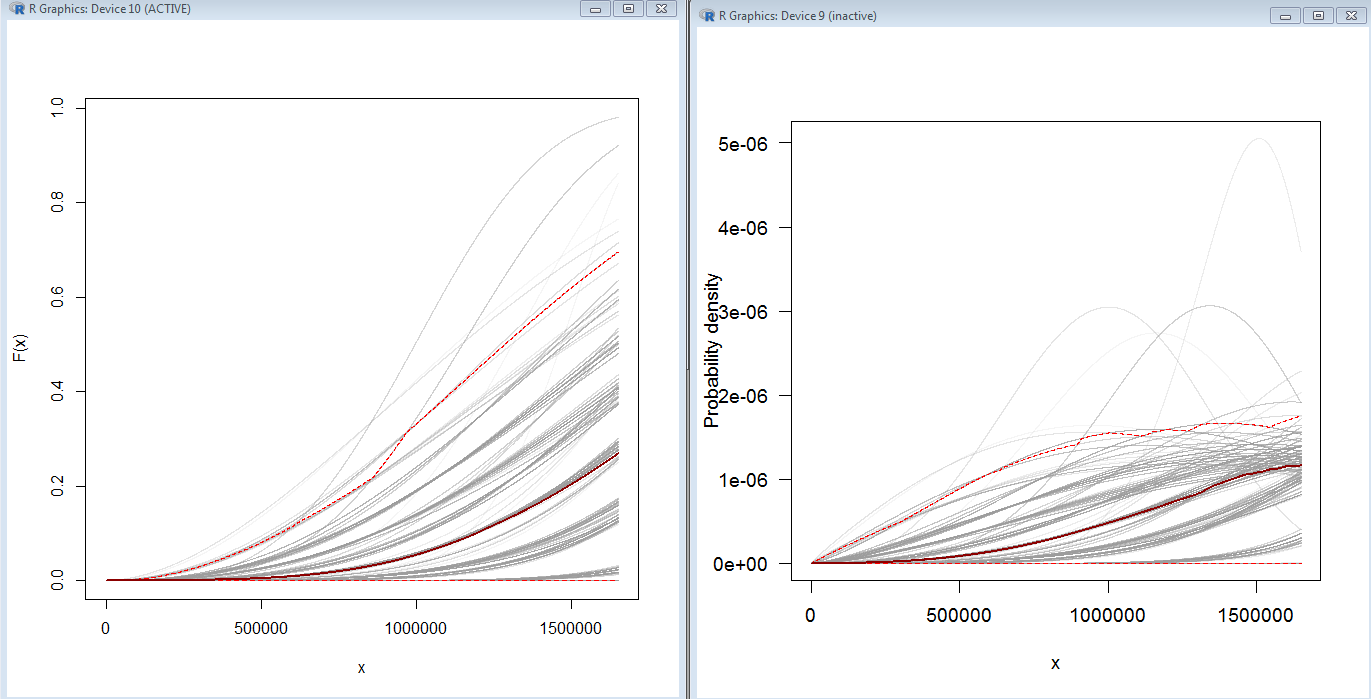
I get :
The problem is when I change the second and third argument , I mean :
1650000 and len=5000 to for example 9650000, len=5000 , the peaks position also displace and don't remain in the same place so it's not only a re scaling the graph.
#-----------------------------------------------------------------------------
# 5. Bootstrapping the pointwise confidence intervals
#-----------------------------------------------------------------------------
library(MASS)
library(car)

set.seed(123)

rw.small <- c(336256,620316,958846,1007830,1080401)

xs <- seq(0, 5, len=500)


boot.pdf <- sapply(1:1000, function(i) {
  xi <- sample(rw.small, size=length(rw.small), replace=TRUE)

}
)

boot.cdf <- sapply(1:1000, function(i) {
  xi <- sample(rw.small, size=length(rw.small), replace=TRUE)

}
)

#-----------------------------------------------------------------------------
# Plot PDF
#-----------------------------------------------------------------------------

par(bg="white", las=1, cex=1.2)
plot(xs, boot.pdf[, 1], type="l", col=rgb(.6, .6, .6, .1), ylim=range(boot.pdf),
     xlab="x", ylab="Probability density")
for(i in 2:ncol(boot.pdf)) lines(xs, boot.pdf[, i], col=rgb(.6, .6, .6, .1))

# Add pointwise confidence bands

quants <- apply(boot.pdf, 1, quantile, c(0.025, 0.5, 0.975))
min.point <- apply(boot.pdf, 1, min, na.rm=TRUE)
max.point <- apply(boot.pdf, 1, max, na.rm=TRUE)
lines(xs, quants[1, ], col="red", lwd=1.5, lty=2)
lines(xs, quants[3, ], col="red", lwd=1.5, lty=2)
lines(xs, quants[2, ], col="darkred", lwd=2)
#lines(xs, min.point, col="purple")
#lines(xs, max.point, col="purple")

