1
$\begingroup$

Hello stats community,

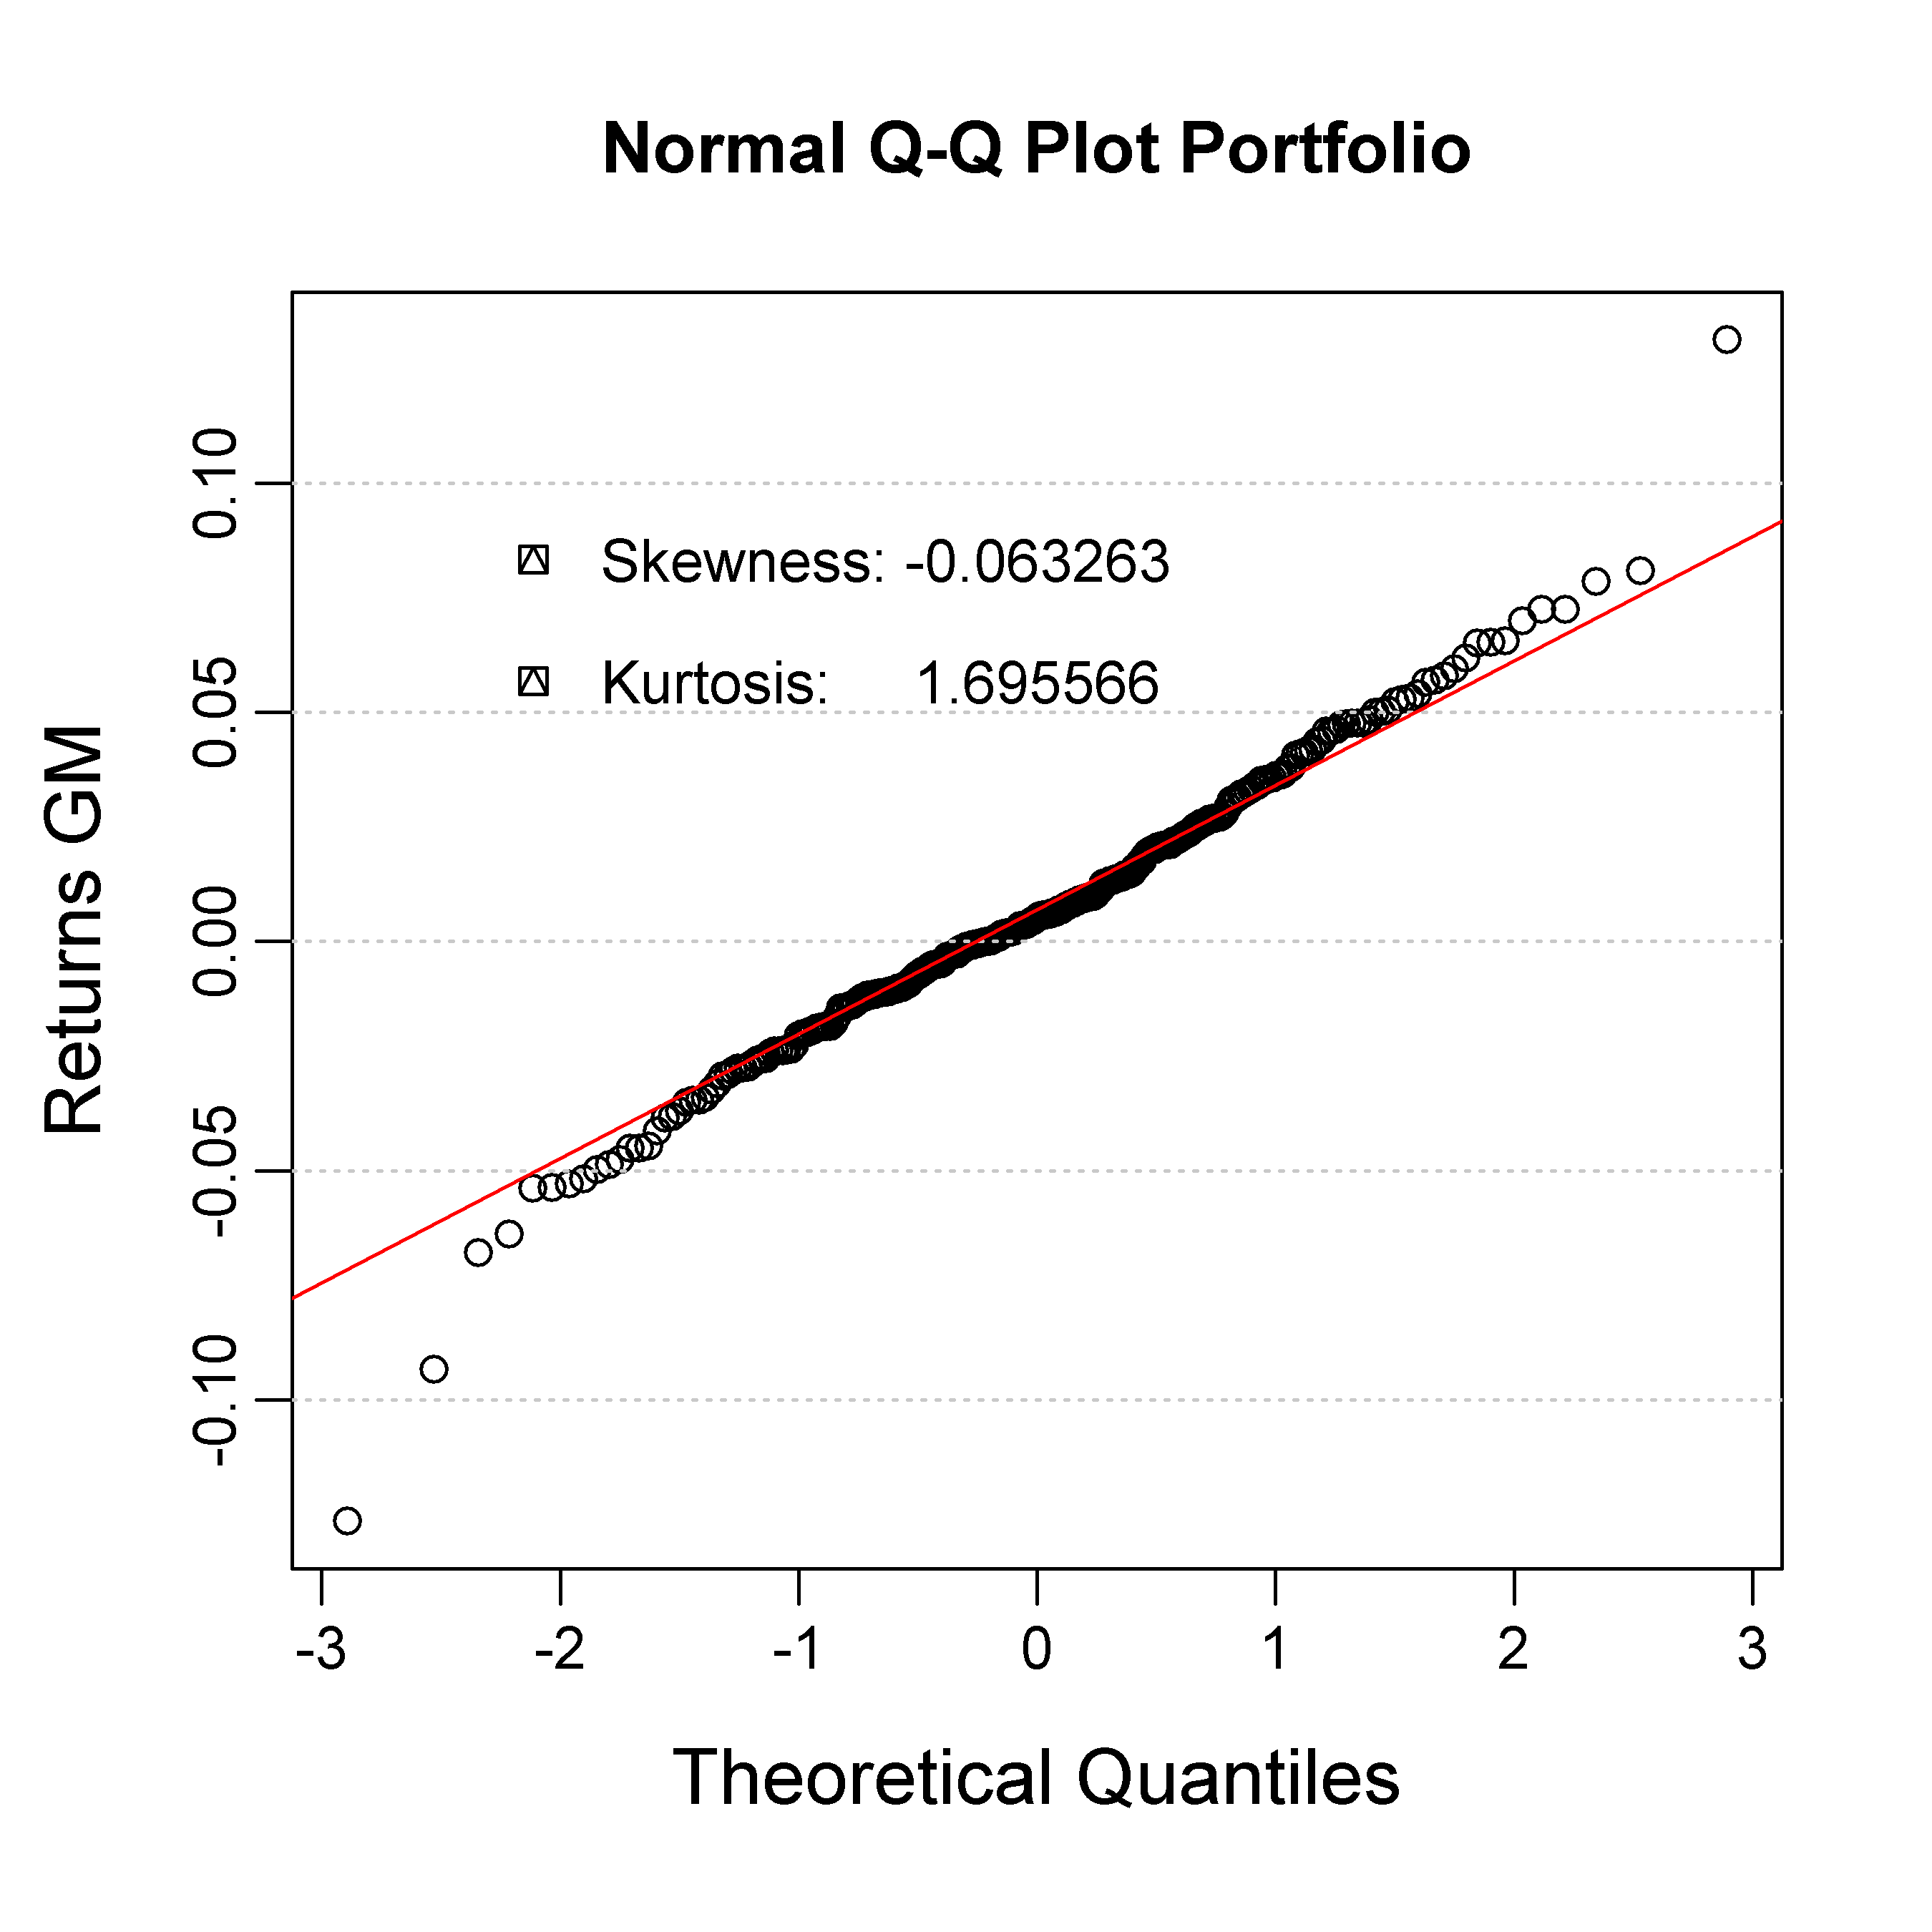
I have a Q-Q plot for my stock returns with a sample of n=262. I drew the plot with qqnorm and qqline(qtype=8). Most of the returns, except for 3 outliers, tend to follow the normal line.

enter image description here

However, when I perform the Shapiro Wilk test, I get a p-value of 0.003197, telling me that I can reject the null-hypothesis that my returns are drawn from a normal distribution.

Test Results:
STATISTIC:
W: 0.983
P VALUE:
0.003197 

Am I missing something? Should I follow my observations or trust the SW test?

$\endgroup$
7
  • $\begingroup$ Trust the test, first and foremost. QQ-plots are just informal tools for building your intuition... These stock returns are not normally distributed, exhibiting a well-documented issue of fat tails. Try t-distribution (t location-scale distribution) instead. $\endgroup$
    – stans
    Commented Aug 19, 2018 at 20:44
  • 1
    $\begingroup$ I don't see the contradiction. The outliers on the left and the one on the right are extreme enough to think that data is not from a normal distribution. The kurtosis is much less than 3. $\endgroup$ Commented Aug 19, 2018 at 20:48
  • $\begingroup$ I do not understand the question: the QQ plot and the test concord with one another $\endgroup$
    – user603
    Commented Aug 19, 2018 at 20:49
  • 2
    $\begingroup$ @Michael That's got to be an excess kurtosis, which is positive due to the long tails. $\endgroup$
    – whuber
    Commented Aug 19, 2018 at 22:42
  • 2
    $\begingroup$ @MichaelLew's answer is good. If you told us more about why you care about Normality you might get a more precise answer: What is the particular question you're trying to answer? What analytical procedure do you plan to follow after this, and how would it change if you did or didn't accept the assumption of Normality? (The trivial/sarcastic answer to your question is "Yes".) $\endgroup$
    – Ben Bolker
    Commented Aug 19, 2018 at 23:53

2 Answers 2

1
$\begingroup$

There is no contradiction between the observation in the QQ plot and the result of the test. Your stock returns have excess kurtosis compared with the normal distribution and this is why the test is rejecting the hypothesis that the data come from a normal distribution. The presence of "outliers" in your data is really just a reflection of the fact that you are trying to fit it to a distribution with tails that are too thin. Try fitting your data to a T-distribution and construct a corresponding QQ plot for this, and you will probably find that it fits quite well.

The presence of excess kurtosis in financial data is common, and it is usually important, since the occurrence of occasional extremes is of high consequence. Extreme positive and negative returns tend to occur more often than in the tails of the normal distribution. For this reason it is common to model financial data using fat-tailed distributions (e.g., the Lévy distribution) or at least fatter tails than the normal (e.g., the T-distribution). The financial analyst Nassim Taleb was highly critical of modelling financial data with the normal distribution, due to the tendency to underestimate the risk of extreme losses (Taleb 2007). He referring to it as "picking up pennies in front of a steam-roller".

$\endgroup$
4
$\begingroup$

Your stock returns are normal enough for most purposes, but will not be strictly normally distributed.

No real world distribution is normally distributed (that distribution stretches from negative infinity up to infinity), and tests for normality will always indicate a statistically significant deviation from normality when the sample size is large enough.

Tests for normality have several good questions and answers on this site. Search if you need more.

$\endgroup$
2
  • 4
    $\begingroup$ "Most purposes" evidently would not include assessing the risk of very negative returns :-). $\endgroup$
    – whuber
    Commented Aug 19, 2018 at 21:09
  • $\begingroup$ Hi: iIt is already well known that stock returns ( atleast for horizons one day or longer ) are not normally distributed so, even if you're test hadn't rejected, it still would be quite wrong to not reject the null. Essentially, a statistical test like you're doing there has a lot of issues and I wouldn't trust either conclusion. If one knows something already, there's no reason to test it. $\endgroup$
    – mlofton
    Commented Aug 20, 2018 at 0:35

Your Answer

By clicking “Post Your Answer”, you agree to our terms of service and acknowledge you have read our privacy policy.

Not the answer you're looking for? Browse other questions tagged or ask your own question.