After reading @whuber's impressive and comprehensive link, it occurs to me that an explanation focused only on the issue of needing expected counts to be 5 or greater might be helpful to you.
Testing whether a Roulette wheel is fair. Suppose I'm used to betting on colors at US roulette. Out of 38 slots around
the wheel there are 2 green, 18 red and 18 black. I'm suspicious that the
wheel is biased so that the probabilities are not really 2/38, 18/38, and 18/38.
An inadequate experiment. I decide to watch 20 spins of the wheel and try a chi-squared test on the results.
The expected counts for green, red, and black would be $E_1 = 20(1/19),\,$
$E_2 = E_3 = 20(9/19),$ respectively. Notice that $E_1 = 1.053$ is much too
small. If $X_1, X_2, X_3$ are the actual observed counts of the three colors in 20 spins, then the
chi-squared statistic is
$$Q = \sum_{i=1}^3 \frac{(X_i - E_i)^2}{E_i}.$$
$Q$ would have approximately the distribution $\mathsf{Chisq}(df = 2)$ under the null hypothesis that the wheel is fair,
provided all of the $E_i$'s were large enough. But in this situation the approximation
is not good.
In practice, the distribution of $Q$ does not need to fit the chi-squared distribution throughout the support of $Q.$ We use only right-tail probabilities to find critical values and to decide whether P-values are small enough to reject the null hypothesis.
In a simulation with a million 20-spin experiments, I found that the tail
probabilities are not quite right. Under $H_0,$ according to $\mathsf{Chisq}(2),$ 95% of the Q-values should
be less than 5.9915. But the actual 95th percentile of the Q-values was about 6.39.
An experiment in which the statistic has chi-squared distribution. By contrast, if I decide to watch 100 spins of the wheel, then $E_1 = 11.11 > 5,$
so the guideline for $Q$ to be chi-squared distributed is met. In another
simulation with a million 100-spin experiments the 95th percentile of
the Q-values was 5.9914, which agrees with the value from $\mathsf{Chisq}(2)$
within simulation error.
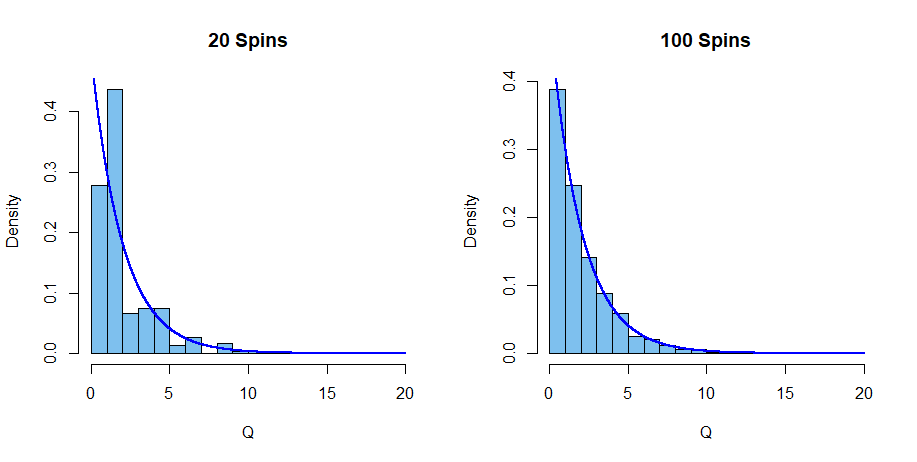
Histograms from the two simulations are shown below, along with the density function of $\mathsf{Chisq}(2).$ It seems clear that, in
the case with 20-spins and an expected count that is too small, the
so-called chi-squared test statistic does not have a chi-squared distribution.

Note: In order to make a compact figure, both histograms were truncated at 20.

