5
$\begingroup$

Let's say i've got a uniform distribution defined as follows $$X \sim U[\min (\theta_1,\theta_2),\max (\theta_1,\theta_2)]$$ I've also got that $\theta_1,\theta_2$ are i.i.d zero-mean normal distributions with variance $\sigma^2$. i.e. $$\theta_k\sim \mathcal{N}(0,\sigma^2) \qquad k \in \lbrace 1,2 \rbrace$$

Question: What is the distribution of $X$, i.e. $f_X(x)$ ?

Efforts: We know that $$f_X(x) = \int\limits f_{X \vert \theta_1,\theta_2}(x \vert \theta_1,\theta_2) f(\theta_1,\theta_2) d\theta_1 d\theta_2$$ Since $\theta_1,\theta_2$ are normal i.i.d, we can say $$f_X(x) = \int\limits f_{X \vert \theta_1,\theta_2}(x \vert \theta_1,\theta_2) \phi_{\sigma}(\theta_1)\phi_{\sigma}(\theta_2) d\theta_1 d\theta_2$$ where $f_{X \vert \theta_1,\theta_2}$ is the uniform distribution bounded by $\theta_1,\theta_2$ and $\phi_{\sigma}(x)$ is the Gaussian PDF with zero mean and standard deviation $\sigma$. This integral is really messy to solve. Does someone know a roundabout of this ?

Spoiler: Through simulations, i've seen that $X$ is normally distributed with zero mean and standard deviation $\sim 0.8166\sigma$.

$\endgroup$
17
  • 2
    $\begingroup$ In your notation, would something like "$U[2,1]$" make sense and be the same as "$U[1,2]$"? BTW, your other notation risks confusing readers because usually "$\Phi$" refers to the Normal CDF and $\phi$ to its pdf. $\endgroup$
    – whuber
    Commented Sep 11, 2018 at 18:34
  • $\begingroup$ Yes $U[1,2]$ is the same as $U[2,1]$. I've edited thanks for noting it out. $\endgroup$ Commented Sep 11, 2018 at 18:35
  • 1
    $\begingroup$ The integral is not that hard to do. Change variables to $\theta_1\pm\theta_2$ and complete the square. $\endgroup$
    – whuber
    Commented Sep 11, 2018 at 19:12
  • 2
    $\begingroup$ stats_model That's a good question. The distribution is not Normal, but it's very close to it. It is (obviously) symmetric, but has a little bit more kurtosis than a Normal distribution would. @Maxtron: there's no problem when $\theta_1=\theta_2,$ because the density near that event is sufficiently small. This isn't necessarily obvious, but becomes apparent when you make the change of variables I previously indicated. $\endgroup$
    – whuber
    Commented Sep 11, 2018 at 22:11
  • 2
    $\begingroup$ @KDG close .. It looks something like this $$\int \frac{1}{t} \Pi(t) e^{-\frac{t^2}{2}}$$ where $\Pi(t)$ is a rect function $\endgroup$ Commented Sep 12, 2018 at 2:54

1 Answer 1

4
$\begingroup$

Let $\psi_1$, $\psi_2$ be order statistics of $N(0,\sigma^2)$.

I used them instead of $\theta$s, then $\psi_1 \leq x\leq\psi_2$ and

$$f_X(x)=\int^\infty_x \int^x_{-\infty}\frac{1}{\psi_2-\psi_1} 2! \phi_{\sigma}(\psi_1)\phi_{\sigma}(\psi_2)d\psi_1d\psi_2$$

Using variable transformation $\eta_1=\frac{1}{\sqrt2} (\psi_2+\psi_1)$ and $\eta_2=\frac{1}{\sqrt2} (\psi_2-\psi_1)$,

$$f_X(x)=\int^\infty_0 \frac{1}{\eta_2} \frac{2}{\sqrt{2 \pi}\sigma}e^{-\frac{\eta_2^2}{2 \sigma^2}}\int^{\sqrt2x+\eta_2}_{\sqrt2x-\eta_2}\frac{1}{\sqrt{2 \pi}\sigma}e^{-\frac{\eta_1^2}{2 \sigma^2}}d\eta_1d\eta_2$$

Say $\Phi$ is a cdf of standard normal distribution,

$$f_X(x)=\int^\infty_0 \frac{1}{\eta_2} \frac{2}{\sqrt{2 \pi}\sigma}e^{-\frac{\eta_2^2}{2 \sigma^2}} \left( \Phi(s+\eta_2/\sigma) -\Phi(s-\eta_2/\sigma) \right)d\eta_2$$ where $s=\sqrt2 x /\sigma$.

Here, adopting another variable transformation $z=\eta_2/\sigma$, we can rewrite this as

$$f_X(x)=\frac{1}{\sigma}\int^\infty_0 \frac{1}{z} \left( \Phi(s+z) -\Phi(s-z) \right) 2\phi(z)dz$$.

This pdf was the simplest form I could make.(maybe due to lack of my ability) I simulated this function and it looks fine. enter image description here
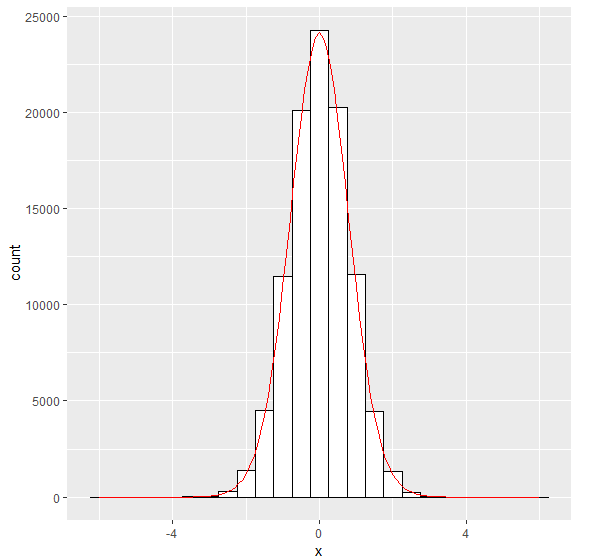
The histogram is the simulated distribution of x and the line is gotten from this pdf. I attached the source code I ran at the end of the post.

I tried to get closed form but I couldn't

I was inspired from here, so I differentiated it with respect to x and after some doing math, I got $$\frac{\partial f_X(x)}{\partial x}=-\frac{2\sqrt2}{\pi \sigma^2} e^{-s^2/2} \int^\infty_0 \frac{1}{z}e^{-z^2}sinh(sz)dz$$

I couldn't do this integration by myself so I put it wolframalphaand it turns out 'imaginary error function'. I don't know about it but I guess this means it would be hard to get closed form of this function. So maybe the pdf form I wrote above the graph would be the best, in my opinion.

I feel sorry that I post this as an answer while I couldn't figure out the closed form of this integration.

Any correction and proofread is completely welcome. Thank you for reading this.

#simulation 1
sigma<-1
n_sim=100000
theta1<-rnorm(n_sim,0,sigma)
theta2<-rnorm(n_sim,0,sigma)

x<-c()
for(i in 1:n_sim){
x[i]<-runif(1)*(max(theta1[i],theta2[i])-min(theta1[i],theta2[i]))+min(theta1[i],theta2[i])
}


#simulation2
fx<-function(x,sigma){
nsim=3000
z<-abs(rnorm(nsim)) # 2 phi(z)
s<-sqrt(2)*x/sigma

C<-c()
for(i in 1:nsim){
C[i]<-1/z[i]*(pnorm(s+z[i])-pnorm(s-z[i]))
}
return(mean(C)/sigma)
}

graph_x<-seq(-6,6,0.1)
graph_y<-c()
for(i in 1:length(graph_x)){
graph_y[i]<-fx(graph_x[i],sigma)
}


#plotting simulation datas
library(ggplot2)

df1<-data.frame(x=x)
df2<-data.frame(x=graph_x, y=graph_y)
ggplot() +geom_histogram(data=df1, aes(x=x),binwidth=.5, colour="black", fill="white") #plot simul. 1
ggplot() +geom_line(data=df2, aes(x=x,y=y),color='red') #plot simul. 2

scale_factor=24000/0.7 # ratio of approximate maximum values between the histogram and the line graph
df2<-data.frame(x=graph_x, y=graph_y*scale_factor)

#this shows combined graph.
ggplot() +geom_histogram(data=df1, aes(x=x),binwidth=.5, colour="black", fill="white")+geom_line(data=df2, aes(x=x,y=y),color='red') 
$\endgroup$
5
  • $\begingroup$ i just gave you a +1 for the beautiful work and the effort. I will make sure i read it carefully after a while .. thank you once again :) $\endgroup$ Commented Sep 12, 2018 at 13:35
  • $\begingroup$ Great work, @KDG $\endgroup$
    – Maxtron
    Commented Sep 12, 2018 at 15:32
  • $\begingroup$ I just added one code line 'graph_y<-c()'. I accidentally missed it. When using this code changing the value of sigma, adjusting the range of graph_x and scale_factor will show better graph. $\endgroup$
    – KDG
    Commented Sep 12, 2018 at 15:41
  • $\begingroup$ And I also corrected my typo :$\eta_1= (\psi_2+\psi_1)$ and $\eta_2=(\psi_2-\psi_1)$ ->$\eta_1=\frac{1}{\sqrt2} (\psi_2+\psi_1)$ and $\eta_2=\frac{1}{\sqrt2} (\psi_2-\psi_1)$ , I omitted $\frac{1}{\sqrt2}$. I am sorry that there was this typo. I made a mistake while writing equations from paper sheet to mathjax . $\endgroup$
    – KDG
    Commented Sep 12, 2018 at 15:47
  • $\begingroup$ +1 Yes, this is the right analysis. $\endgroup$
    – whuber
    Commented Sep 12, 2018 at 16:50

Your Answer

By clicking “Post Your Answer”, you agree to our terms of service and acknowledge you have read our privacy policy.

Not the answer you're looking for? Browse other questions tagged or ask your own question.