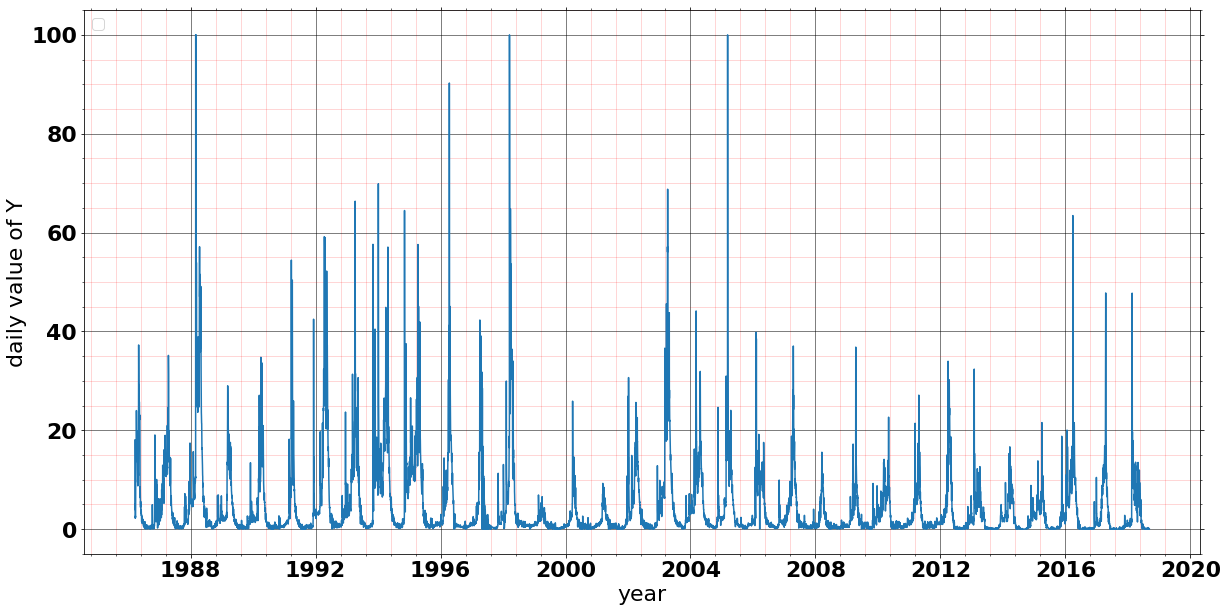
I have a weather parameter (daily volume of inflow for a river in million cubic meters, MCM) time series data as follows:
 I want to scale this data and feed it to a
 LSTM network. I know that by choosing a practical and good method of scaling, performance of the LSTM highly increases.
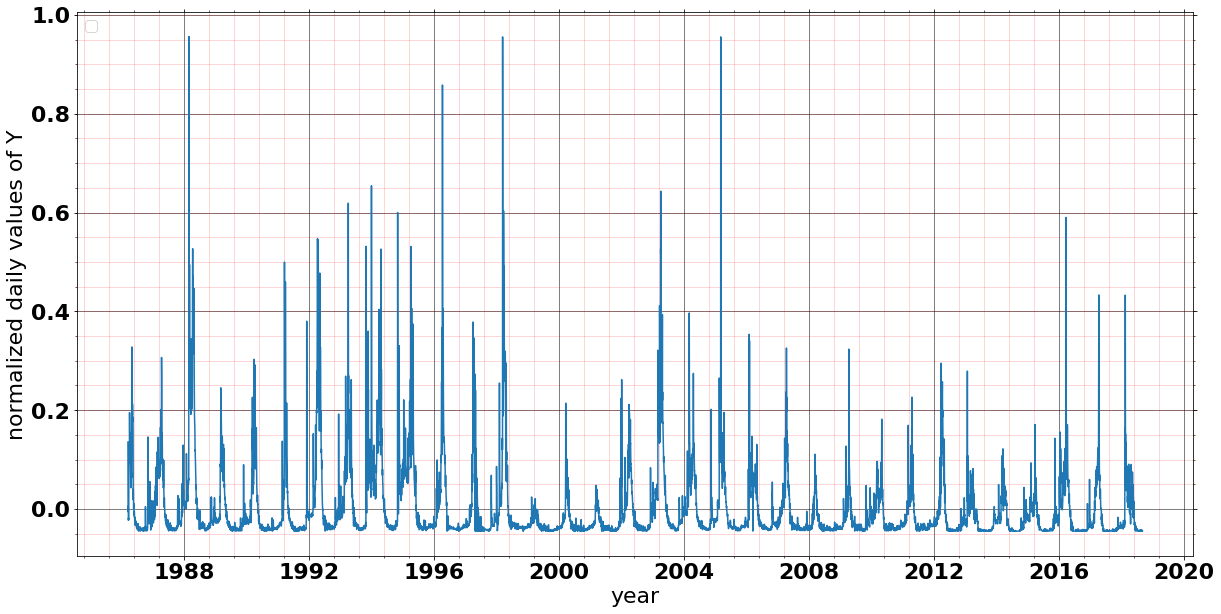
I think using tools like MinMaxScaler in python's sklearn.preprocessing would not be a good choice in this case, since all values are above zero and by scaling to a range between -1 and 1, data just become smaller and nothing changes. Also, when I try to normalize the data using this method:df_norm = (df - df.mean()) / (df.max() - df.min()), the results become:
 So, I think this also is not a good choice.
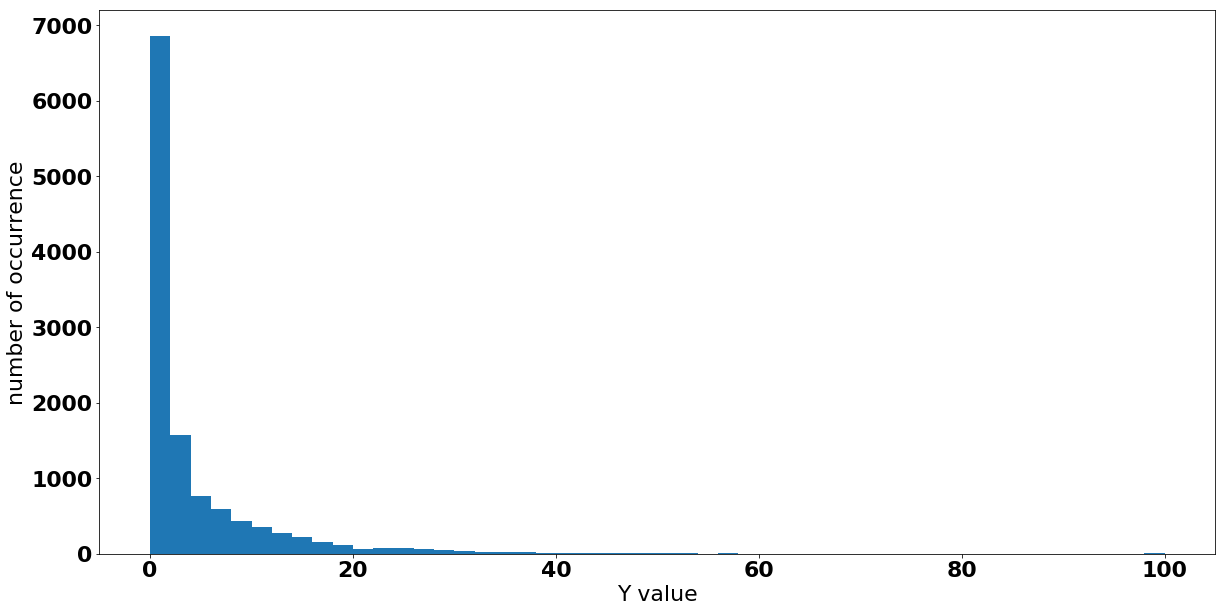
Here is the histogram results of the data:
 The goal is to be able to create a predictive model in which I can predict 7 days ahead using LSTM.
What would be a suitable scaling technique for this kind of data?
-
$\begingroup$ Weather is not the same as any one of dry-bulb, wet-bulb, precipitation, irradience, wind speed, cover, or visibility. There are summary methods that convert to metric-days, such as cooling-degree-days where they only count degrees-time above a threshold temperature. It is a offset heaviside sum. Heating degree days is a negative scaled offset heaviside sum. You have to say what the goal is first. There are an infinite number of transforms with infinite members, so finding the right one requires a clear rubric. $\endgroup$– EngrStudentCommented Oct 2, 2018 at 20:38
-
$\begingroup$ Thanks for the comment. Added a note at the end of my question. Maybe that could clarify the goal. $\endgroup$– hyTuevCommented Oct 2, 2018 at 21:06
-
1$\begingroup$ Now you are requiring the evocation of Nyquist's sampling theorem, and geospatial sampling. Every system has a "characteristic time" such that if you sample at twice that rate (or about 5x that rate in the presence of reasonable noise) you are unsurprised by its behavior. When dealing with geographically distributed events, the sampling becomes spatial, and instead of sampling tighter, you have to sample wider. The "joy" (challenge) of weather data is that measuring stations are non-uniformly, non-randomly, distributed. $\endgroup$– EngrStudentCommented Oct 3, 2018 at 11:33
-
$\begingroup$ Fyi: scientificamerican.com/article/… $\endgroup$– EngrStudentCommented Oct 17, 2018 at 12:51
2 Answers
My normal disclaimers apply.
I would start by looking at the data with my eyes to get a sense of the time-domain characteristic scales, and make sure my sampling was sufficient. That means hourly, daily, weekly, and monthly. All those times would have to be in the input data. I would look at the data with my eyes to get a sense of the spatial distribution, which includes the diameter of "storms", and the center-track to center-track variation storm-to-storm. This would give me both the spatial sample-to-sample distance, and the width of the whole spatial field.
Let's say that I had that kind of data, how do I pre-process it to accelerate convergence?
Options can include:
- center by central tendence, scale by tendency of variation
- use PCA to change to an "eigen" domain, and work in those terms
- detrend
- Use Fourier methods to pull out the clearly cyclic stuff
- Use time-series over very long times to pull out seasonality and trending
- this list is potentially infinitely long....
The "why" I use drives the "what".
- If my phenomena is stationary then center + scale (#1) is great for moving all the values close to one (reduce numeric runaways) and making scales more human-comprehensible.
- If I have spanned all data, and there isn't a whole lot of variation (not very common in weather) then PCA can be deeply amazing for dimensionality reduction.
- If my phenomena is fundamentally linear then detrend allows me to do a pre-process that makes the learner spend more of its training cycles doing the hard work instead of non-value-returning work.
- If my phenomena is clearly cycling (think electric circuits, electric motors, or acoustics) then Fourier isn't a bad way to recontrive the domain simple and informatively.
- If my phenomena is fundamentally, and non-chaotically autoregressive then the time-series approach isn't bad. Again it speaks to the "physics" of the problem and re-contrives it so the learner has a much simpler job.
Good news: Weather is less crazy than the stock market. Bad news: Weather is much tougher than many other problems.
MinMaxScaler uses a single max and min value for the entire data and hence won't take care of the outliers Try using RobustScaler for scaling. It takes care of the outliers. You can find more information about it here http://scikit-learn.org/stable/modules/generated/sklearn.preprocessing.RobustScaler.html
