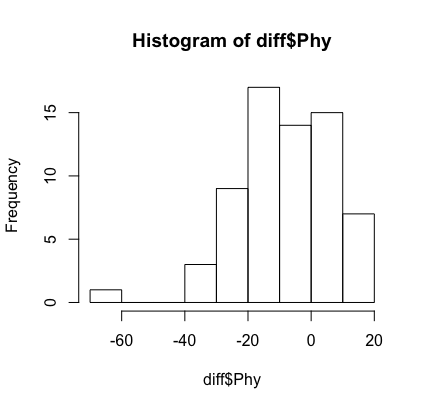
I have a paired data with n=66. I understand that normality condition of differences data should be met to conduct a paired t-test. However, from the histogram, it doesn't appear so normal. The p-value of the Shapiro Wilk test is 0.068. The skewness and kurtosis are -0.63 and 4.18 respectively. Would the t-test be still reliable under these conditions or should I go for non-parametric tests?
-
$\begingroup$ What are you actually testing - whether the mean of the differences is different to $0$? $\endgroup$– jbowmanCommented Oct 18, 2018 at 16:42
-
$\begingroup$ I'm testing whether the differences is greater than 0 i.e. one-tailed t-test. $\endgroup$– Mohamad SahilCommented Oct 18, 2018 at 17:07
-
$\begingroup$ So are you interested in a non-parametric version of the t-test then? Wilcoxon signed-rank test? $\endgroup$– user2974951Commented Oct 19, 2018 at 7:24
1 Answer
It actually isn't important that the differences be normally distributed, just that they are close enough so that the Central Limit Theorem has "taken over" at your sample size and the sample mean is close to normally distributed. Close enough can be quite far away even for small sample sizes; sample means of samples of size $12$ from a Uniform distribution used to be used to generate Normally distributed random variates in the early days of random number generation.
To see whether this is the case in an informal way, there are several checks we can do. One is to look at what the skewness and kurtosis of the sample mean with sample size $n=66$ from a population with the same skewness and kurtosis as you've observed would be. As it happens, these two statistics converge to $0$ and $3$ respectively at the rate $1/\sqrt{n}$, so in your case the sample mean would have an estimated skewness of $0.084$ and kurtosis of $3.14$, neither of which is far from the Normal distribution values of $0$ and $3$. This would indicate, again in an informal way, that the $t$-test should work reasonably well for you.
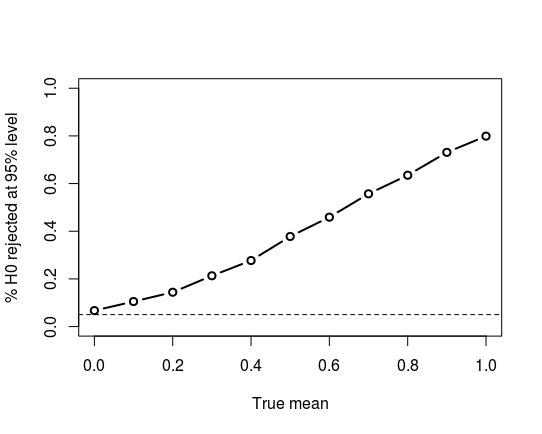
Another approach is to see how well the t-test performs on randomly-generated data that is distributed like your observed sample. Since I don't have access to your data, I'm a little limited in this regard; however, as an outline of one such approach, I'll assume your data follows a Pearson Type IV distribution (the member of the Pearson family of distributions that can have the given skewness and kurtosis) with parameters such that the true mean is $0$, standard deviation is $1$, and skewness and kurtosis as given. We generate $1000$ samples from the distribution with different means and see how well the $t$ test does in terms of Type I and Type II errors:
tstat <- matrix(0,1000,11)
for (j in 1:nrow(tstat)) {
      x <- rpearsonIV(66, m=8.06, nu=8.7,
      location=6.0087, scale=9.752)
      for (i in 1:ncol(tstat)) {
        delta <- (i-1)/10
        tstat[j, i] <- t.test(x+delta,
                  alternative="greater")$p.value
      }
    }

tpower <- colMeans(tstat < 0.05)
And a plot of the power curve:
Overall, it appears, in an informal way, that the $t$-test should work well for you, although there may be tests that slightly outperform it.
One issue with finding alternative tests is making sure that you are testing what you want to test. For example, the Wilcoxon one-sample test assumes symmetry, so, in effect, tests for symmetry of the data around a median of $0$, which is not likely what you want. (Running it on the data generated above gives an 11% rejection rate when the null hypothesis is true and we are testing at the 95% level of confidence.) The sign test is highly robust, but tests for the median of the data equal to (in your case) $0$, which may not be what you want. So care is needed in formulating your null hypothesis to match your actual problem!


