9
$\begingroup$

I want to select models using regsubsets(). I have a dataframe called olympiadaten (data uploaded: http://www.sendspace.com/file/8e27d0). I first attach this dataframe and then start to analyze, my code is:

attach(olympiadaten)

library(leaps)
a<-regsubsets(Gesamt ~ CommunistSocialist + CountrySize + GNI + Lifeexp + 
              Schoolyears + ExpMilitary + Mortality +
PopPoverty + PopTotal + ExpEdu + ExpHealth, data=olympiadaten, nbest=2)
summary(a)
plot(a,scale="adjr2")


summary(lm(Gesamt~ExpHealth))

screenshot of the plot:
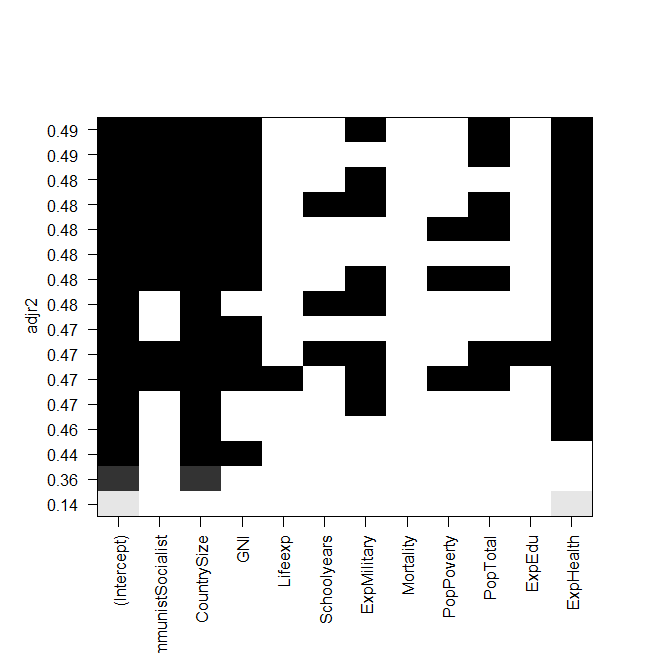
http://tinypic.com/r/2pq8agy/6

The problem is now, that I want to fit the best model again "manually" and have a look at it, but the value of the adjusted R squared is not the same as in the regsubsets output? This is also the case for the other models, e.g. when I do the simplest model in the graphic:

summary(lm(Gesamt~ExpHealth))

The graphic says, it should have an adjusted R squared of about 0.14, but when I look at the output, I get a value of 0.06435.

Here is the output of summary(lm(Gesamt~ExpHealth)):

Call:
lm(formula = Gesamt ~ ExpHealth)

Residuals:
    Min      1Q  Median      3Q     Max 
-18.686  -9.856  -4.496   1.434  81.980 

Coefficients:
            Estimate Std. Error t value Pr(>|t|)  
(Intercept)  -3.0681     6.1683  -0.497   0.6203  
ExpHealth     1.9903     0.7805   2.550   0.0127 *
---
Signif. codes:  0 ‘***’ 0.001 ‘**’ 0.01 ‘*’ 0.05 ‘.’ 0.1 ‘ ’ 1 

Residual standard error: 18.71 on 79 degrees of freedom
  (4 observations deleted due to missingness)
Multiple R-squared: 0.07605,    Adjusted R-squared: 0.06435 
F-statistic: 6.502 on 1 and 79 DF,  p-value: 0.01271 

I don't know what I might have done wrong, any help would be appreciated.

And last but not least, some more questions:

  • What is the difference between selecting models by AIC and by the adj. R squared?
  • Both measure the fit and recognize the number of variables, so isn't the best model chosen by AIC also the model with the highest adj. r squared?
  • When I have 12 variables, this means, there are $2^12$ possibilities of models, right?
  • So does the regsubsets() command calculate each model and show the two best (nbest=2) of each size?
  • If so, do I really get the 'best' model?
  • And when I do AIC using backwards selection (starting with the model which contains all variables), does this also end up with the same model that regsubsets() says is the best?
$\endgroup$
11
  • 1
    $\begingroup$ The difference in adjusted $R^2$ is because some of the variables have missing values. I believe you would get the same adjusted $R^2$ if you fitted the model "manually" just using the subset of the data for which all the variables (in the formula in regsubsets) are non-missing. Note: choosing your model using regsubsets is considered to be a poor method. $\endgroup$
    – mark999
    Commented Sep 26, 2012 at 10:29
  • 1
    $\begingroup$ @mark999 Your comments are good and it looks like it gives the right answer. You should convert it to an answer. $\endgroup$ Commented Sep 26, 2012 at 11:06
  • $\begingroup$ Thanks @MichaelChernick but I prefer just to leave it as a comment. $\endgroup$
    – mark999
    Commented Sep 26, 2012 at 11:11
  • $\begingroup$ @user1690846 I recommend looking at Peter Flom's answer to stats.stackexchange.com/questions/8303/… $\endgroup$
    – mark999
    Commented Sep 26, 2012 at 11:14
  • $\begingroup$ @mark999 first of all thanks for an answer, but why is this a poor method? And is selecting with AIC better? So should I fitt the model by using na.omit(olympiadaten) ? If anyone has an answer to the other questions any futher answers would be very appreciated, thanks $\endgroup$ Commented Sep 26, 2012 at 11:18

2 Answers 2

8
$\begingroup$

To further the idea about using all subsets or best subsets tools for finding a "Best" fitting model, The book "How to Lie with Statistics" by Darrell Huff tells a story about Readers Digest publishing a comparison of the chemicals in cigarette smoke. The point of their article was to show that there was no real difference between the different brands, but one brand was lowest in some of the chemicals (but by so little that the difference was meaningless) and that brand started a big advertisement campaign based on being the "lowest" or "best" according to Readers Digest.

All subsets or best subsets regressions are similar, the real message from the graph you show is not "here is the Best" but really that there is no one best model. From a statistical view (using adjusted r-squared) the majority of your model are pretty much the same (the few at the bottom are inferior to those above, but the rest are all similar). Your wanting to find a "Best" model from that table is like the cigarette company saying that their product was the best when the purpose was to show that they were all similar.

Here is something to try, randomly delete one point from the dataset and rerun the analysis, do you get the same "Best" model? or does it change? repeat a few times deleting a different point each time to see how the "Best" model changes. Are you really comfortable claiming a model is "Best" when that small of a change in the data gives a different "Best"? Also look at how much different the coefficients are between the different models, how do you interpret those changes?

It is better to understand the question and the science behind the data and use that information to help decide on a "Best" model. Consider 2 models that are very similar the only difference is that one model includes $x_1$ and the other includes $x_2$ instead. The model with $x_1$ fits slightly better (adj r-squared of 0.49 vs. 0.48) however to measure $x_1$ requires surgery and waiting 2 weeks for lab results while measuring $x_2$ takes 5 minutes and a Sphygmomanometer. Would it really be worth the extra time, expense, and risk to get that extra 0.01 in the adjuster r-squared, or would the better model be the quicker, cheaper, safer model? What makes sense from the science standpoint? In your example above do you really think that increasing spending on the military will improve olympic performance? or is this a case of that variable acting as a surrogate for other spending variables that would have more direct affect?

Other things to consider include taking several good models and combining them (Model Averaging), or rather than having each variable be either all in or all out adding some form of penalty (Ridge regression, LASSO, elasticnet,...).

$\endgroup$
1
  • $\begingroup$ Good answer! Highlights to "It is better to understand the question and the science behind the data and use that information to help decide on a "Best" model" and all the paragraph that follows. $\endgroup$ Commented Feb 11, 2014 at 15:45
2
$\begingroup$

Some questions have been answered so I am only addressing the ones regarding model selection. AIC, BIC, Mallow Cp and adjusted R$^2$ are all methods to compare and select models that tke into account problems of overfitted models by an adjusted measure or a penalty function in the criteria. But in cases where the penalty functions differ it is very possible for two similar criteria to lead to different choices for a final model. The minimum value for different criteria can occurat different models. This has been observed quite often when looking at models chosen by AIC and BIC.

I really don't know what you mean by best model. Each criterion essentially give a different definition of best. You can call a model best in terms of information, entropy, stochastic complexity, percentage variance explained (adjusted) and more. If you are dealing with a specific crtierion and are meaning by best capturing the true minimum for say AIC over all possible models then that can only be guaranteed by looking at all models (i.e. all subset selections for the variables). Step-up, step-down and step-wise procedure do not always find the best model in the sense of a specific crtierion. With step-wise regression you can even get different answers by starting a different models. I am sure Frank Harrell would have a lot to say about this.

To learn more, there are several good books on model/subset selection available and I have referenced some here on other posts. Also Lacey Gunter's monograph with Springer in their SpringerBrief series will be coming out soon. I was a coauthor with her on that book.

$\endgroup$

Your Answer

By clicking “Post Your Answer”, you agree to our terms of service and acknowledge you have read our privacy policy.

Not the answer you're looking for? Browse other questions tagged or ask your own question.